AUGUST KEY FIGURES
 | | Aug 12 | Jul 12 to Aug 12 | Aug 11 to Aug 12 |
| | no. | % change | % change |
|
| TREND | | | |
| Total dwelling units approved | 12 600 | -0.1 | 1.0 |
| Private sector houses | 7 278 | 0.7 | -3.8 |
| Private sector dwellings excluding houses | 5 148 | -1.3 | 12.2 |
| SEASONALLY ADJUSTED | | | |
| Total dwelling units approved | 12 046 | 6.4 | -15.4 |
| Private sector houses | 7 314 | -0.5 | -4.2 |
| Private sector dwellings excluding houses | 4 596 | 23.0 | -25.7 |
|
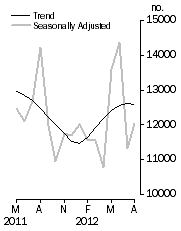
Dwelling units approved
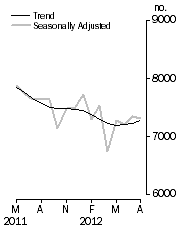
| Private sector houses approved
|
AUGUST KEY POINTS
TOTAL DWELLING UNITS
- The trend estimate for total dwellings approved fell 0.1% in August after rising for 6 months.
- The seasonally adjusted estimate for total dwellings approved rose 6.4% in August following a fall of 21.2% in the previous month.
PRIVATE SECTOR HOUSES
- The trend estimate for private sector houses approved rose 0.7% in August and has risen for 3 months.
- The seasonally adjusted estimate for private sector houses fell 0.5% in August following a rise of 1.9% in the previous month.
PRIVATE SECTOR DWELLINGS EXCLUDING HOUSES
- The trend estimate for private sector dwellings excluding houses fell 1.3% in August after rising for 6 months.
- The seasonally adjusted estimate for private sector dwellings excluding houses rose 23.0% in August following a fall of 46.7% in the previous month.
VALUE OF BUILDING APPROVED
- The trend estimate of the value of total building approved fell 2.2% in August and has fallen for 2 months. The value of residential building fell 0.9% and has fallen for 2 months. The value of non-residential building fell 3.9% and has fallen for 3 months.
- The seasonally adjusted estimate of the value of total building approved rose 9.4% in August after falling for 2 months. The value of residential building rose 9.2% following a fall of 23.5% in the previous month. The value of non-residential building rose 9.8% after falling for 2 months.
NOTES
FORTHCOMING ISSUES
| ISSUE | Release Date |
| August 2012 | 11 October 2012 |
| September 2012 | 31 October 2012 |
| October 2012 | 4 December 2012 |
| November 2012 | 10 January 2013 |
| December 2012 | 4 February 2013 |
| January 2013 | 4 March 2013 |
CHANGES IN THIS ISSUE
From the September 2012 issue the secondary 'Additional Information' release will cease with all outputs combined in the main release.
From the September 2012 issue the time series identifiers for 'Total value of building jobs' series in tables 69-77 will change. A correspondence between the old and new identifiers for each affected series is provided in a spreadsheet titled 'Changes to Time Series Identifiers' under the downloads tab of this issue.
DATA NOTES
The statistics for Western Australia in recent months may have been impacted by the WA Building Act 2011 which came into effect on 2 April 2012.
Data relating to a large public sector housing program was revised into the relevant approval periods for the Northern Territory between May 2008 and September 2010.
A number of time series spreadsheets contain 'np' (not available for publication) annotations. This is due to confidential data being contained in these series.
REVISIONS THIS MONTH
Revisions to the total number of dwelling units approved in this issue are:
| 2011-12 | 2012-13 | TOTAL |
|
| NSW | 55 | 42 | 97 |
| Vic. | 481 | 12 | 493 |
| Qld | - | - | - |
| SA | 91 | - | 91 |
| WA | 278 | -2 | 276 |
| Tas. | - | - | - |
| NT | - | - | - |
| ACT | 31 | - | 31 |
| Total | 936 | 52 | 988 |
|
INQUIRIES
For further information about these and related statistics, contact the National Information and Referral Service on 1300 135 070.
 Quality Declaration
  Print Page
 Print All