MARCH QTR KEY FIGURES
 | Dec Qtr 05 to Mar Qtr 06 | Mar Qtr 05 to Mar Qtr 06 |
| Established house prices | % change | % change |
|
| Weighted average of eight capital cities | 1.0 | 3.6 |
| Sydney | -1.2 | -3.1 |
| Melbourne | 0.8 | 3.8 |
| Brisbane | 0.0 | 2.8 |
| Adelaide | 2.4 | 5.3 |
| Perth | 8.8 | 28.8 |
| Hobart | 3.4 | 9.9 |
| Darwin | 3.0 | 17.4 |
| Canberra | 0.2 | 1.4 |
|
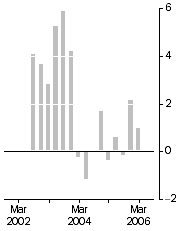
Established house prices, Weighted average of eight capital cities - Quarterly % change

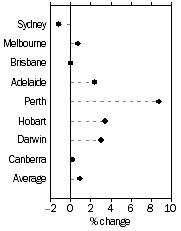
| Established house prices, Quarterly % change - March quarter 2006

|
MARCH QTR KEY POINTS
ESTABLISHED HOUSE PRICES
Quarterly Changes
- Preliminary estimates show the price index for established houses in Australia increased 1.0% in the March quarter 2006, compared with the movement of 2.2% in the December quarter 2005.
- House prices rose in Perth (+8.8%), Hobart (+3.4%), Darwin (+3.0%), Adelaide (+2.4%), Melbourne (+0.8%) and Canberra (+0.2%), remained unchanged in Brisbane and fell in Sydney by 1.2%.
- The movement in the established house price index between September and December quarters 2005 has been revised from an estimated preliminary increase of 2.1% to an increase of 2.2%.
Annual Changes (March quarter 2005 to March quarter 2006)
- Over the twelve months to March quarter 2006, preliminary estimates show that established house prices rose 3.6%.
- Annually, house prices rose in Perth (+28.8%), Darwin (+17.4%), Hobart (+9.9%), Adelaide (+5.3%), Melbourne (+3.8%), Brisbane (+2.8%) and Canberra (+1.4%). House prices fell in Sydney by 3.1%.
- The movement in the established house price index between December quarters 2004 and 2005 has been revised from an estimated preliminary rise of 2.3% to a rise of 2.2%.
NOTES
FORTHCOMING ISSUES
| ISSUE (QUARTER) | Release Date |
| June 2006 | 24 August 2006 |
| September 2006 | 15 November 2006 |
CHANGES IN THIS ISSUE
There are no changes in this issue.
REVISIONS IN THIS ISSUE
For the established house series in this publication, the price indexes and percentage changes for the two most recent quarters are subject to revision as more complete data sets are obtained from the State/Territory Land Titles Office or Valuers' General Office in each capital city. The tables affected are 1, 2, 5, and 6. The median house prices and number of house transfers in tables 7 and 8 may be revised for some earlier quarters as well. For more information, refer to paragraphs 12, 13 and 27 of the Explanatory Notes.
CHANGES TO TIME SERIES SPREADSHEETS
The time series spreadsheets associated with this publication have been converted from Lotus 1-2-3 .wks format to Excel .xls format. Information paper: Changes to Time Series Spreadsheets for House Price Indexes, Eight Capital Cities, cat. no. 6416.0.55.001, advising users of this change, was released on 28 March 2006 and provides a concordance between the old Lotus 1-2-3 .wks spreadsheets and the new Excel .xls format.
INQUIRIES
For further information about these and related statistics, contact Mark King on Canberra (02) 6252 5342 or the National Information and Referral Service on 1300 135 070.
 Print Page
 Print All