|
|
NOVEMBER KEY FIGURES
 | Nov 04 | Oct 04 to Nov 04 | Nov 03 to Nov 04 |
| no. | % change | % change |
TREND |
|
| Total dwelling units approved | 12,466 | -2.1 | -17.2 |
| Private sector houses | 8,688 | -0.3 | -14.4 |
| Private sector other dwellings | 3,338 | -6.9 | -27.5 |
SEASONALLY ADJUSTED |
|
| Total dwelling units approved | 12,716 | -0.3 | -12.8 |
| Private sector houses | 8,804 | 0.9 | -13.5 |
| Private sector other dwellings | 3,419 | -5.4 | -16.7 |
|
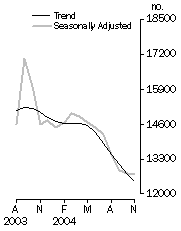
Dwelling units approved
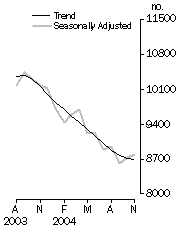
| Private sector houses approved
|
NOVEMBER KEY POINTS
TOTAL DWELLING UNITS
- The trend estimate for total dwelling units approved fell 2.1% in November 2004. The trend has fallen for the last seven months.
- The seasonally adjusted estimate for total dwelling units approved fell 0.3%, to 12,716, in November 2004. This is the eighth consecutive monthly fall, with the November estimate being the lowest since June 2001.
PRIVATE SECTOR HOUSES
- The trend estimate for private sector houses approved fell 0.3% in November 2004. The trend has now fallen for fourteen consecutive months, although the rate of decline has slowed over recent months.
- The seasonally adjusted estimate for private sector houses approved rose 0.9%, to 8,804, in November 2004.
PRIVATE SECTOR OTHER DWELLING UNITS
- The trend estimate for private sector other dwellings approved fell 6.9% in November 2004.
- The seasonally adjusted estimate for private sector other dwellings approved fell 5.4%, to 3,419, in November 2004. This is the sixth consecutive monthly decline.
VALUE OF BUILDING APPROVED
- The seasonally adjusted estimate of the value of total building approved fell 3.8%, to $4,151.1m, in November 2004. The value of new residential building approved fell 1.0%, to $2,350.9m, while the value of residential alterations and additions rose 3.6%, to $413.1m.
NOTES
CHANGES IN THIS ISSUE
As part of ongoing improvements to the ABS seasonal adjustment methodology, an improved method for removing trading day effects from seasonally adjusted estimates has been introduced. Corrections for trading day effects are now applied as prior corrections to the original estimates, rather than being applied within the seasonal adjustment process. This is now consistent with treatment of appropriate corrections for large extremes, changes in level, changes in seasonal pattern, Easter, and other effects. This change in methodology will result in revisions to seasonally adjusted and trend estimates.
REVISIONS THIS MONTH
Revisions have been made to total dwelling units in this issue:
| 2003-04 | 2004-05 | TOTAL |
|
| New South Wales | -31 | -7 | -38 |
| Victoria | 1 | 42 | 43 |
| Queensland | - | 33 | 33 |
| South Australia | - | 1 | 1 |
| Western Australia | 24 | -141 | -117 |
| Tasmania | - | - | - |
| Northern Territory | - | - | - |
| Australian Capital Territory | - | - | - |
| TOTAL | -6 | -72 | -78 |
|
DATA NOTES
Estimates have been included in this issue for four councils unable to report all building work approved in their municipalities this month (Campbelltown in New South Wales, Pine Rivers and Mackay in Queensland, and Swan in Western Australia).
INQUIRIES
For further information about these and related statistics, contact the National Information and Referral Service on 1300 135 070 or David Finlay on Adelaide (08) 8237 7431.
SUMMARY COMMENTARY
VALUE OF BUILDING APPROVED
NEW RESIDENTIAL BUILDING
The trend estimate of the value of new residential building is showing a steady decline over the last seven months, falling 1.0% in November 2004.
ALTERATIONS AND ADDITIONS TO RESIDENTIAL BUILDING
The trend estimate of the value of alterations and additions to residential building is showing a decline over the last five months. The trend fell 1.1% in November 2004.
NON-RESIDENTIAL BUILDING
The trend estimate of the value of non-residential building is now relatively flat, falling 0.4% in November 2004.
DWELLINGS APPROVED
TOTAL DWELLING UNITS
The trend estimate for total dwelling units approved is showing a decline over the last seven months.
PRIVATE SECTOR HOUSES
The trend estimate for private sector houses approved has shown a decline for the last fourteen months, with the decline slowing in recent months. The trend fell 0.3% in November 2004.
PRIVATE SECTOR OTHER DWELLINGS
The trend estimate for private sector other dwellings approved has fallen strongly over the past six months. The trend fell 6.9% in November 2004.
DWELLING UNITS APPROVED- STATES AND TERRITORIES
SUMMARY COMMENTS
The trend estimate for total dwelling units approved fell 2.1% in November 2004. The trend fell in all states and territories, except Tasmania, which rose 2.2%.
The trend estimate for private sector houses approved fell 0.3% in November 2004. The trend continued to fall in New South Wales (-2.2%), Victoria (-1.2%) and South Australia (-0.3%). The trend rose in Queensland (+1.3%) and Western Australia (+1.2%) in November 2004, the fourth consecutive monthly rise in both states.
| | NSW | Vic. | Qld | SA | WA | Tas. | NT | ACT | Aust. | |
Original | |
| |
| Dwelling units approved | | | | | | | | | | |
| Private sector houses (no.) | 1,799 | 2,678 | 2,195 | 735 | 1,699 | 216 | 28 | 61 | 9,411 | |
| Total dwelling units (no.) | 2,966 | 3,540 | 3,193 | 903 | 1,903 | 271 | 89 | 274 | 13,139 | |
| Percentage change from previous month | | | | | | | | | | |
| Private sector houses (%) | 18.3 | 7.0 | 1.8 | 19.9 | 16.5 | 8.0 | -36.4 | -6.2 | 9.9 | |
| Total dwelling units (%) | 3.6 | -1.4 | -0.6 | 1.9 | -2.7 | 4.2 | 11.3 | 265.3 | 1.7 | |
Seasonally Adjusted | |
| |
| Dwelling units approved | | | | | | | | | | |
| Private sector houses (no.) | 1,540 | 2,563 | 2,204 | 663 | 1,556 | na | na | na | 8,804 | |
| Total dwelling units (no.) | 2,859 | 3,425 | 3,234 | 831 | 1,760 | 250 | na | na | 12,716 | |
| Percentage change from previous month | | | | | | | | | | |
| Private sector houses (%) | -0.4 | 3.3 | -1.8 | 1.7 | 3.5 | na | na | na | 0.9 | |
| Total dwelling units (%) | 9.3 | -4.0 | -2.5 | -10.2 | -8.4 | -3.5 | na | na | -0.3 | |
Trend | |
| |
| Dwelling units approved | | | | | | | | | | |
| Private sector houses (no.) | 1,543 | 2,476 | 2,197 | 643 | 1,532 | na | na | na | 8,688 | |
| Total dwelling units (no.) | 2,740 | 3,412 | 3,291 | 804 | 1,851 | 234 | 97 | 68 | 12,466 | |
| Percentage change from previous month | | | | | | | | | | |
| Private sector houses (%) | -2.2 | -1.2 | 1.3 | -0.3 | 1.2 | na | na | na | -0.3 | |
| Total dwelling units (%) | -4.5 | -0.4 | -0.4 | -3.5 | -2.1 | 2.2 | -13.4 | -16.0 | -2.1 | |
| |
| na not available |
DWELLING UNITS APPROVED
State Trends
NEW SOUTH WALES
The trend estimate for total dwelling units approved in New South Wales has fallen for the last eight months. The trend for private sector houses is showing declines for the last fifteen months.
VICTORIA
The trend estimate for total dwelling units in Victoria is now showing a decline over the past fourteen months. The trend for private sector houses shows a general decline over the past fifteen months.
QUEENSLAND
The general decline in the trend estimate for total dwelling units approved in Queensland, evident over the last fourteen months, has slowed. The trend for private sector houses is showing a rise over the last four months.
SOUTH AUSTRALIA
The trend estimate for total dwelling units approved in South Australia is now showing a steady decline over the past five months. The trend for private sector houses is showing a slowing in the general decline evident since September 2003.
WESTERN AUSTRALIA
The trend estimate for total dwelling units approved in Western Australia is now showing a decline over the past six months. The trend for private sector houses is now showing a rise over the past four months.
|
 Print Page
 Print All