JUNE KEY FIGURES
 | | Credit market outstandings at end | Demand for credit during | Other changes during | Credit market outstandings at end |
| | Mar Qtr 2013 | Jun Qtr 2013 | Jun Qtr 2013 | Jun Qtr 2013 |
| NON-FINANCIAL DOMESTIC SECTORS | $b | $b | $b | $b |
|
| Non-financial corporations | | | | |
| Investment funds | 182.6 | 1.1 | 0.9 | 184.6 |
| Other private | 2 226.6 | 23.5 | -44.4 | 2 205.7 |
| National public | 1.6 | -0.4 | - | 1.2 |
| State and local public | 111.3 | -3.5 | - | 107.8 |
| General government | | | | |
| National | 302.9 | -6.7 | -4.6 | 291.6 |
| State and local | 128.9 | 7.5 | - | 136.4 |
| Households | 1 643.1 | 22.2 | 0.2 | 1 665.5 |
| Total | 4 597.1 | 43.9 | -48.0 | 4 593.0 |
|
| - nil or rounded to zero (including null cells) |
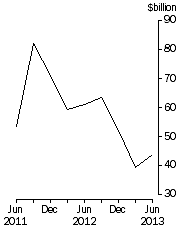
Total demand for credit
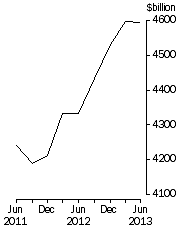
| Credit market outstandings
|
JUNE KEY POINTS
SUMMARY
- Total credit market outstanding of the domestic non-financial sectors at 30 June 2013 was $4,593.0b, a decrease of $4.1b from the previous quarter. Demand for credit during the quarter was $43.9b and valuation decreases were $48.0b.
- Demand for credit increased by $4.6b from the previous quarter, driven by other private non-financial corporations (up $8.6b), state and local general government (up $5.8b), and household (up $5.2b). This was offset by a decreased demand for credit by national general government (down $12.8b).
NON-FINANCIAL CORPORATIONS
- Other private non-financial corporations raised a net $23.5b, through loan borrowings of $15.1b, issuances of shares of $8.2b and issuances of bonds of $3.8b.
GENERAL GOVERNMENT
- National general government repaid a net $6.7b during the quarter driven by redemptions of one name paper of $11.5b. This was partially offset by issuances of bonds $4.6b. State and local general government raised $7.5b during the quarter primarily through loans of $7.1b.
HOUSEHOLDS
- Households raised a net $22.2b primarily through loans of $22.8b during the June quarter 2013, up $5.3b from the March quarter 2013 estimate of $17.5b.
NOTES
FORTHCOMING ISSUES
| ISSUE (QUARTER) | Release Date |
| September 2013 | 19 December 2013 |
| December 2013 | 27 March 2014 |
| March 2014 | 26 June 2014 |
| June 2014 | 25 September 2014 |
CHANGES TO THIS ISSUE
- Following ongoing quality assurance work a number of data quality issues have been identified with table 37 - National capital accounts by sector and subsector. This table will be unavailable until further notice. However, capital accounts by sector will continue to be published as part of table 22 - flow of funds matrix.
SIGNIFICANT EVENTS
- During the June quarter 2013, the investment activity of a national public non financial corporation unit has been confidentialised to maintain the anonymity of the unit. As a consequence of suppressing estimates directly impacted, it has been necessary to consequentially suppress other series in the affected tables to preserve confidentiality.
- In the September quarter 2013 issue of Financial Accounts, two new tables will be published. The first table is a quarterly balance sheet for the household sector. The second table contains analytical measures of income, consumption, saving and wealth for the household sector. Both tables are quarterly counterparts to annual tables already published in Australian System of National Accounts (cat no 5204.0). These new tables will be available in electronic format only, and will not appear in the PDF.
- The September quarter 2013 publication will also include revisions to previously published aggregated back to June quarter 1988 as part quality assurance work undertaken through reviews of compilation of the published estimates and through data providers to the ABS. This is the first time the timeseries has been revised back to June 1988 since the implementation of 2008 SNA in September quarter 2009.
- The Central bank, banks, securitisers, long term loans and placements market and bond market tables include estimates for internally securitised paper. Please refer to ABS treatment of internally securitised paper released with the March 2012 issue of the publication for the treatment of these securities.
REVISIONS IN THIS ISSUE
- There have been revisions back to September 2007 to previously published aggregates. This is due to quality assurance work undertaken through reviews of compilation of the published estimates and through data providers to the ABS Survey of Financial Information, ABS Survey of International Investment and APRA administrative data sets.
INQUIRIES
- For further information about these and related statistics, contact the National Information and Referral Service on 1300 135 070 or Sachind Naidu on Canberra (02) 6252 6417, email <national.accounts@abs.gov.au>.
INQUIRIES
For further information about these and related statistics, contact the National Information and Referral Service on 1300 135 070 or Sachind Naidu on Canberra (02) 6252 6417, email <national.accounts@ abs.gov.au>.
 Quality Declaration
  Print Page
 Print All