PRICE INDEXES AND CONTRACT PRICE INDEXATION
JUNE QUARTER KEY FIGURES
 | Mar Qtr 06 to Jun Qtr 06 | Jun Qtr 05 to Jun Qtr 06 |
| STAGE OF PRODUCTION | % change | % change |
|
| Final (Stage 3) commodities (excl. exports) | 1.6 | 4.5 |
| Domestic | 1.8 | 4.9 |
| Imports | 0.7 | 2.3 |
| Intermediate (Stage 2) commodities | 2.8 | 8.0 |
| Domestic | 2.6 | 7.5 |
| Imports | 3.8 | 10.8 |
| Preliminary (Stage 1) commodities | 3.1 | 9.4 |
| Domestic | 2.7 | 8.7 |
| Imports | 4.9 | 13.8 |
|
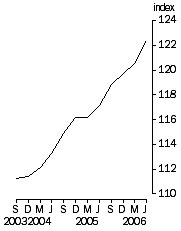
Final Stage, Base: 1998-99 = 100.0
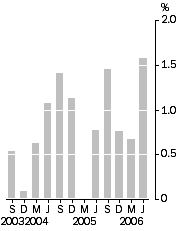
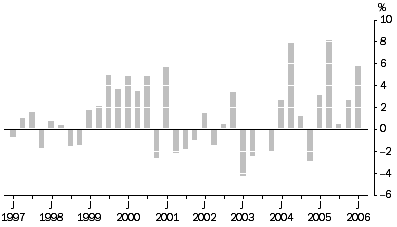
| Final Stage, Quarterly % change
|
JUNE QUARTER KEY POINTS
FINAL (STAGE 3) COMMODITIES
- The final (Stage 3) index rose 1.6% in the June quarter 2006.
- The domestic component rose 1.8%, mainly due to increases in petroleum refining, building construction and other agriculture (includes bananas). These increases were partially offset by decreases in commercial fishing.
- The imports component rose 0.7%, due to price increases for consumption goods, including petroleum refining and other manufacturing. Imports of capital goods showed no change, due to higher prices for industrial machinery which were offset by lower prices for electronic equipment.
INTERMEDIATE (STAGE 2) COMMODITIES
- The intermediate (Stage 2) index rose 2.8% in the June quarter 2006.
- The domestic component rose 2.6%, mainly due to increases in basic non-ferrous metals, metal ore mining, petroleum refining, and grain, sheep, beef and dairy farming. These increases were partially offset by a decrease in electricity, gas and water supply.
- The imports component rose 3.8%, due to oil and gas extraction, petroleum refining, fabricated metal products and basic non-ferrous metals. These increases were partially offset by a decrease in electronic equipment.
PRELIMINARY (STAGE 1) COMMODITIES
- The preliminary (Stage 1) index rose 3.1% in the June quarter 2006.
- The domestic component rose 2.7% mainly due to basic non-ferrous metals, petroleum refining and oil and gas extraction. These increases were partially offset by a decrease in electricity, gas and water supply.
- The imports component rose 4.9%, due to oil and gas extraction, petroleum refining and basic non-ferrous metals. These increases were partially offset by a decrease in electronic equipment.
NOTES
FORTHCOMING ISSUES
| ISSUE (QUARTER) | Release Date |
| September 2006 | 23 October 2006 |
| December 2006 | 22 January 2007 |
CHANGES IN THIS ISSUE
There are no changes in this issue.
RELATED STATISTICS
For more information about statistics in this publication contact Steve Whennan on Canberra (02) 6252 6251, or email <steve.whennan@abs.gov.au>.
INQUIRIES
For further information about these and related statistics, contact the National Information and Referral Service on 1300 135 070 or Steve Whennan on Canberra (02) 6252 6251.
COMMENTARY
STAGE OF PRODUCTION OVERVIEW
Each of the three stage of production indexes increased in the June quarter 2006, with the preliminary (Stage 1) index showing the largest rise of 3.1%, followed by an increase of 2.8% for the intermediate (Stage 2) index, and an increase of 1.6% for the final (Stage 3) index. Through the year to June quarter 2006, the preliminary (Stage 1) index increased by 9.4%, followed by an increase of 8.0% for the intermediate (Stage 2) index and an increase of 4.5% for the final (Stage 3) index.
The increase of 1.6% in the final (Stage 3) index reflects an increase of 1.8% in the price of domestically produced items and an increase of 0.7% in the price of imported items. The domestic component increased due to price rises for petroleum refining, building construction and other agriculture, which were partially offset by decreases in commercial fishing and electricity, gas and water supply. The imports component increased due to price rises for petroleum refining and industrial machinery manufacturing, which were partially offset by decreases in electronic equipment manufacturing.
The increase of 2.8% in the intermediate (Stage 2) index reflects an increase of 2.6% in the price of domestically produced items and an increase of 3.8% in the price of imported items. The domestic component increased due to price rises for basic non-ferrous metals, metal ore mining, petroleum refining, grain, sheep, beef and dairy farming, oil and gas extraction and property operators and developers, which were partially offset by price decreases for electricity, gas and water supply and iron and steel manufacturing. The imports component increased due to price rises for oil and gas extraction, petroleum refining, fabricated metal products and basic non-ferrous metals, which were partially offset by price falls for electronic equipment manufacturing and photographic and scientific equipment.
The increase of 3.1% in the preliminary (Stage 1) index reflects an increase of 2.7% in the price of domestically produced items and an increase of 4.9% in the price of imported items. The domestic component increased due to price rises for basic non-ferrous metals, petroleum refining, oil and gas extraction, metal ore mining and property operators and developers, which were partially offset by price decreases for electricity, gas and water supply, and iron and steel manufacturing. The imports component increased due to price rises for oil and gas extraction, petroleum refining, basic non-ferrous metals and fabricated metal products, which were partially offset by price falls for electronic equipment manufacturing.
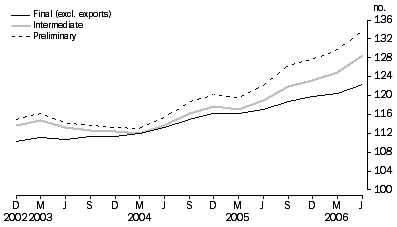
COMPARISION OF SOP INDEXES: Base: 1998-99 = 100.0
MANUFACTURING INDUSTRIES PRODUCER PRICE INDEXES
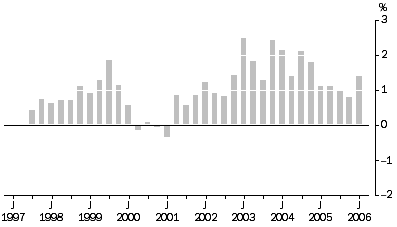
During the June quarter 2006, the prices paid by manufacturers for their material inputs increased by 5.8%, while the prices they received for their outputs increased by 4.8%. The input price index increased by 18.1% through the year to June quarter 2006 and the output price index increased by 9.9% during the same period.
Increases in the price of crude oil (both domestic and imported), domestically sourced copper oxides, whole milk, gold and cattle and calves were the main contributors to the quarterly result for the materials used in manufacturing industries index. Price decreases for barley, imported door furniture fittings and white wine grapes provided some offset to these increases.
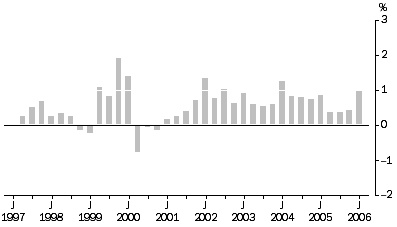
Higher prices for unleaded petroleum, diesel, copper and alloy extruded products for export, leaded petroleum, copper and alloy products for export, alumina and kerosene contributed to the bulk of the increase in the articles produced by manufacturing industries index for the June quarter 2006. These increases were partially offset by decreases in the prices of other machinery and equipment.
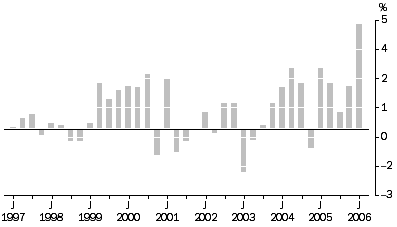
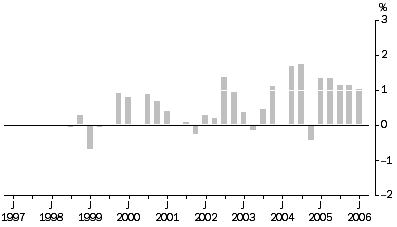
ARTICLES PRODUCED BY MANUFACTURING INDUSTRIES: All Groups, Quarterly % change
 MATERIALS USED IN MANUFACTURING INDUSTRIES: All Groups, Quarterly % change
CONSTRUCTION INDUSTRIES PRODUCER PRICE INDEXES
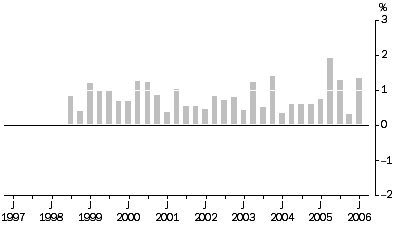
The price indexes for materials used in house building increased by 1.0% in the June quarter 2006, reflecting price increases for a range of materials. The most significant contributors to the increase were aluminium windows, paint and other coatings, in-situ concrete, timber windows and insulation. Offsetting price decreases were recorded for plaster and plaster products, switches and lamps, boarding and lining, and joinery. Increases were recorded in all of the state capitals, ranging from 0.5% in Melbourne, to 1.5% in Sydney.
Through the year to June quarter 2006, the materials used in the house building index rose 2.1%.
Materials Used in House Building: All Groups, Quarterly % change
The price index for the output of the general construction industry increased by 1.4% in the June quarter 2006, and by 4.4% through the year to June quarter 2006. Increases were registered in the quarter for all component industries, with the index for non-residential building construction being the largest contributor, followed by house construction, residential building construction other than houses, and road and bridge construction.
Contributing to the movement in the general construction industry price indexes this quarter were increases in the cost of material and labour inputs. Materials using copper had the largest impact of the material inputs, combined with higher fuel costs. Increases in labour costs had a reduced effect this quarter.
New South Wales provided the greatest contribution to the increase in the price index for the output of the general construction industry this quarter, followed by Western Australia and Queensland.
OUTPUT OF THE General Construction INDUSTRY: All Groups, Quarterly % change
SERVICE INDUSTRIES PRODUCER PRICE INDEXES
The property and business services industries price index increased by 1.4% in the June quarter 2006 and by 4.9% through the year to June quarter 2006. The property services price index increased by 2.3% this quarter with increases for real estate agents and commercial property operators. These increases were partially offset by a decrease in the price of motor vehicle hiring.Through the year to June quarter 2006 the property services index rose 6.8%.
Property and Business Services Industry: All Groups, Quarterly % change
The business services index increased by 0.7% in the June quarter 2006 and by 3.7% through the year to June quarter 2006. The main contributors to the increase were business management services and accounting services. These increases were partially offset by decreases in security and investigation services and information storage and retrieval services.
The transport (freight) and storage industries index increased by 1.0% in the June quarter 2006. The most significant contributors with price increases were road freight and rail freight transport. The most significant contributors with price decreases were scheduled international air freight and international sea transport. Through the year to June quarter 2006 the transport (freight) and storage industries index rose by 4.7%.
Transport (Freight) and Storage Industries: All Groups, Quarterly % change
 Print Page
 Print All