|
|
JULY KEY FIGURES
 |  | Jul 04 | Jun 04 to Jul 04 | Jul 03 to Jul 04 |
 |  | no. | % change | % change |
Trend |
|
| Dwelling units approved |  |  |  |
 | Private sector houses | 9,116 | -1.0 | -10.6 |
 | Total dwelling units | 14,437 | -0.3 | -3.1 |
Seasonally Adjusted |
|
| Dwelling units approved |  |  |  |
 | Private sector houses | 8,960 | -2.8 | -12.9 |
 | Total dwelling units | 14,438 | -0.7 | -5.1 |
|
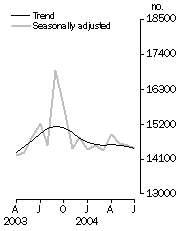
Dwelling units approved, Total number

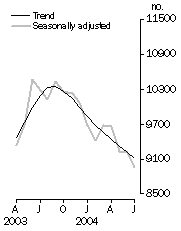
| Private sector houses approved, Total number

|
JULY KEY POINTS
TREND ESTIMATES
- The trend estimate for total dwelling units approved fell 0.3% in July 2004. This series has been relatively flat for the past 5 months.
- The trend estimate for private sector houses approved fell 1.0% in July 2004. The trend has now fallen for ten consecutive months.
- The trend estimate for other dwellings approved has risen for the last seven months, with the rate of growth slowing in recent months. The trend rose 0.5% in July 2004.
SEASONALLY ADJUSTED ESTIMATES
- The seasonally adjusted estimate for total dwelling units approved fell 0.7%, to 14,438, in July 2004.
- The seasonally adjusted estimate for private sector houses approved fell 2.8%, to 8,960, in July 2004.
- The seasonally adjusted estimate for other dwellings approved rose 4.1%, to 5,286, in July 2004.
- The seasonally adjusted estimate of the value of total building approved rose 0.6%, to $4,244.4m, in July 2004. The value of new residential building approved fell for the second consecutive month, falling 3.1% in July 2004, to $2,477.0m.
NOTES
CHANGES IN THIS ISSUE
A new base year, 2002–03, has been introduced into the chain volume estimates which has resulted in revisions to growth rates in subsequent periods. In addition, the chain volume estimates have been re-referenced to 2002–03, thereby preserving additivity in the quarters after the reference year. Re-referencing affects the levels of, but not the movements in, chain volume estimates.
A feature article, 'Are We Building on Smaller Blocks?', is included on pages 7–9.
The ABS is planning changes to the format and content of the front page of this publication from the August 2004 issue.
REVISIONS THIS MONTH
Revisions have been made to total dwelling units in this issue:
 | 2003-04 |
|
| New South Wales | 164 |
| Victoria | -46 |
| Queensland | -56 |
| South Australia | 5 |
| Western Australia | -19 |
| Tasmania | -2 |
| TOTAL | 46 |
|
A significant upward revision has been made to the value of non-residential building approved in May 2004, mostly as a result of including a previously unreported approval in New South Wales.
DATA NOTES
There will be 232 permanent dwellings constructed for the Commonwealth Games Village as well as some non-residential construction. All the buildings will be included as public sector. As a result, 9 dwellings included in May 2004 will be reclassified from private to public. A further 101 dwellings have been included in July 2004. The remaining approvals are expected to be submitted prior to the end of 2005.
Estimates have been included in this issue for two councils unable to report all building work approved in their municipalities this month (Blue Mountains in New South Wales and Rockingham in Western Australia).
INQUIRIES
For further information about these and related statistics, contact the National Information and Referral Service on 1300 135 070 or David Finlay on Adelaide (08) 8237 7431.
SUMMARY COMMENTARY
VALUE OF BUILDING APPROVED
NEW RESIDENTIAL BUILDING
The trend estimate of the value of new residential building is now showing a decline over the last three months, falling 1.1% in July 2004.
ALTERATIONS AND ADDITIONS TO RESIDENTIAL BUILDING
The trend estimate of the value of alterations and additions to residential building has risen over the last five months, following five months of decline. The trend rose 1.6% in July 2004.
NON-RESIDENTIAL BUILDING
The trend estimate of the value of non-residential building continues the general decline starting in December 2002, falling 1.4% in July 2004.
DWELLINGS APPROVED
TOTAL DWELLING UNITS
The trend estimate for total dwelling units approved has been relatively flat for the last five months.
PRIVATE SECTOR HOUSES
The trend estimate for private sector houses approved has fallen for the last ten months after eight months of growth. The trend fell 1.0% in July 2004.
OTHER DWELLINGS
The trend estimate for other dwellings approved has risen for the last seven months with growth slowing in recent months. The trend rose 0.5% in July 2004.
DWELLING UNITS APPROVED, STATES AND TERRITORIES
SUMMARY COMMENTS
The trend estimate for total dwelling units approved fell 0.3% in July 2004. The trend fell in New South Wales (-1.4%), Victoria (-1.9%), Tasmania (-1.8%) and the Australian Capital Territory (-9.8%).
The trend estimate for private sector houses approved fell 1.0% in July 2004. The trend fell in all states except Victoria (+0.4%) and South Australia (+0.7%).
 |  | NSW | Vic. | Qld | SA | WA | Tas. | NT | ACT | Aust. |  |
Original |  |
|  |
| Dwelling units approved |  |  |  |  |  |  |  |  |  |  |
 | Private sector houses (no.) | 1,609 | 2,930 | 2,233 | 662 | 1,517 | 190 | 50 | 72 | 9,263 |  |
 | Total dwelling units (no.) | 3,481 | 3,779 | 3,544 | 1,087 | 2,210 | 221 | 125 | 72 | 14,519 |  |
| Percentage change from previous month |  |  |  |  |  |  |  |  |  |  |
 | Private sector houses (%) | -18.4 | -0.3 | 1.5 | -20.5 | -2.4 | -3.6 | 56.3 | -1.4 | -5.5 |  |
 | Total dwelling units (%) | -4.4 | 3.3 | -7.1 | -0.1 | 3.2 | -5.6 | -10.1 | -62.7 | -2.6 |  |
Seasonally Adjusted |  |
|  |
| Dwelling units approved |  |  |  |  |  |  |  |  |  |  |
 | Private sector houses (no.) | 1,651 | 2,845 | 2,073 | 627 | 1,437 | na | na | na | 8,960 |  |
 | Total dwelling units (no.) | 3,636 | 3,694 | 3,381 | 1,052 | 2,242 | 233 | na | na | 14,438 |  |
| Percentage change from previous month |  |  |  |  |  |  |  |  |  |  |
 | Private sector houses (%) | -9.1 | 2.5 | 0.1 | -17.8 | -2.0 | na | na | na | -2.8 |  |
 | Total dwelling units (%) | -4.5 | 5.6 | -6.7 | 3.4 | 11.8 | -2.9 | na | na | -0.7 |  |
Trend |  |
|  |
| Dwelling units approved |  |  |  |  |  |  |  |  |  |  |
 | Private sector houses (no.) | 1,754 | 2,805 | 2,040 | 686 | 1,487 | na | na | na | 9,116 |  |
 | Total dwelling units (no.) | 3,733 | 3,540 | 3,360 | 1,004 | 2,108 | 270 | 135 | 202 | 14,437 |  |
| Percentage change from previous month |  |  |  |  |  |  |  |  |  |  |
 | Private sector houses (%) | -1.2 | 0.4 | -2.4 | 0.7 | -1.9 | na | na | na | -1.0 |  |
 | Total dwelling units (%) | -1.4 | -1.9 | 0.3 | 5.5 | 1.6 | -1.8 | 7.1 | -9.8 | -0.3 |  |
|  |
| na not available |
STATE TRENDS
NEW SOUTH WALES
The trend estimate for total dwelling units approved in New South Wales has fallen for the last four months, following four months of growth. The trend for private sector houses is showing declines for the last eleven months.
VICTORIA
The trend estimate for total dwelling units in Victoria has fallen for the last three months. The trend for private sector houses approved is now showing slight growth for the last four months.
QUEENSLAND
The trend estimate for total dwelling units approved in Queensland is flat after falling for the previous nine months. The trend for private sector houses has fallen for the last nine months.
SOUTH AUSTRALIA
The trend estimate for total dwelling units approved in South Australia has risen for the last four months. The trend for private sector houses has been flat for the last five months.
WESTERN AUSTRALIA
The trend estimate for total dwelling units approved in Western Australia has risen for the last ten months. The trend for private sector houses has fallen for the last five months.
|
 Print Page
 Print All