|
|
December Key Figures
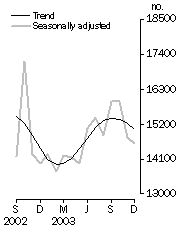
Dwelling units approved, Total number
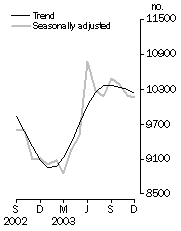
| Private sector houses approved, Total number
|
December Key Points
TREND ESTIMATES
- The trend estimate for total dwelling units approved fell 1.3% in December 2003, and is now showing a fall over the last three months. The trend is now falling in all states and territories except South Australia and Western Australia. While those states are still showing growth, the rate of growth has slowed significantly.
- The trend estimate for private sector houses approved fell 0.8% in December 2003, following falls in October and November.
- The trend estimate for other dwellings approved fell 2.9% in December 2003, the third consecutive monthly fall.
SEASONALLY ADJUSTED ESTIMATES
- The seasonally adjusted estimate for total dwelling units approved fell 1.5%, to 14,578, in December 2003.
- The seasonally adjusted estimate for private sector houses approved fell 0.5%, to 10,159, in December 2003.
- The seasonally adjusted estimate for other dwellings approved fell 6.9%, to 4,158, in December 2003. This follows a 17.3% fall in November.
- The seasonally adjusted estimate of the value of total building approved rose 18.7%, to $4,309.7 million, in December 2003, following a 21.6% fall in November. Residential building rose 1.5%, to $2,884.5 million, while non-residential building rose to $1,425.2 million, following the low value in November.
Notes
CHANGES IN THIS ISSUE
There are no changes in this issue.
REVISIONS THIS MONTH
Revisions have been made to total dwelling units in this issue:
 |
| 2002-03 | 2003-04 | TOTAL | |
| |
| New South Wales | 40 | 21 | 61 | |
| Victoria | 27 | 64 | 91 | |
| Queensland | - | 16 | 16 | |
| South Australia | 1 | - | 1 | |
| Western Australia | - | 7 | 7 | |
| Tasmania | - | - | - | |
| Northern Territory | - | - | - | |
| Australian Capital Territory | - | - | - | |
| TOTAL | 68 | 108 | 176 | |
| |
DATA NOTES
Estimates have been included in this issue for two councils unable to report all building work approved in their municipalities this month: Wingecarribee (New South Wales) and Playford (South Australia).
A special article on ‘Average Floor Area of New Dwellings’ in the years 1984-85 to 2002-03 is included in this issue.
Inquiries
For further information about these and related statistics, contact the National Information and Referral Service on 1300 135 070 or Andrea Woods on Adelaide (08) 8237 7350.
VALUE OF BUILDING APPROVED
NEW RESIDENTIAL BUILDING
The trend estimate of the value of new residential building has fallen for the last two months, following eight months of growth. The trend fell 0.7% in December 2003.
ALTERATIONS AND ADDITIONS TO RESIDENTIAL BUILDING
The trend estimate of the value of alterations and additions to residential building fell 0.2% in December 2003, following twelve months of growth.
NON-RESIDENTIAL BUILDING
The trend estimate of the value of non-residential building approved has fallen for the last five months, following four months of growth. The trend fell 5.1% in December 2003.
DWELLINGS APPROVED
TOTAL DWELLING UNITS
The trend estimate for total dwelling units approved is now showing a fall over the last three months, following seven months of growth. The trend fell 1.3% in December 2003.
PRIVATE SECTOR HOUSES
The trend estimate for private sector houses approved has fallen for the last three months, following eight months of growth. The trend fell 0.8% in December 2003.
OTHER DWELLINGS
The trend estimate for other dwellings approved has fallen for the last three months, following four months of growth. The trend fell 2.9% in December 2003.
DWELLING UNITS APPROVED - STATES AND TERRITORIES
SUMMARY COMMENTS
The trend estimate for total dwelling units approved fell 1.3% in December 2003. The trend fell in all states and territories except South Australia (+0.1%) and Western Australia (+1.2%).
The trend estimate for private sector houses approved fell 0.8% in December 2003. The trend fell in New South Wales, Victoria and South Australia, while rising in Queensland and Western Australia.
|
| | NSW | Vic. | Qld | SA | WA | Tas. | NT | ACT | Aust. | |
Original | |
| |
| Dwelling units approved | | | | | | | | | | |
| Private sector houses (no.) | 2,013 | 2,554 | 2,383 | 770 | 1,640 | 195 | 37 | 96 | 9,688 | |
| Total dwelling units (no.) | 3,899 | 3,297 | 3,236 | 1,193 | 1,914 | 233 | 45 | 144 | 13,961 | |
| Percentage change from previous month | | | | | | | | | | |
| Private sector houses (%) | 0.1 | -11.8 | -1.7 | 11.3 | 3.3 | -20.1 | 76.2 | -20.0 | -3.1 | |
| Total dwelling units (%) | 3.7 | -7.1 | -12.5 | 43.4 | -4.5 | -28.3 | -10.0 | 15.2 | -2.7 | |
Seasonally Adjusted | |
| |
| Dwelling units approved | | | | | | | | | | |
| Private sector houses (no.) | 2,025 | 2,651 | 2,663 | 782 | 1,701 | na | na | na | 10,159 | |
| Total dwelling units (no.) | 3,891 | 3,505 | 3,594 | 1,125 | 2,045 | 224 | na | na | 14,578 | |
| Percentage change from previous month | | | | | | | | | | |
| Private sector houses (%) | 4.6 | -13.3 | 2.2 | 12.0 | 9.7 | na | na | na | -0.5 | |
| Total dwelling units (%) | 7.8 | -11.0 | -6.3 | 25.5 | 0.4 | -21.9 | na | na | -1.5 | |
Trend | |
| |
| Dwelling units approved | | | | | | | | | | |
| Private sector houses (no.) | 1,993 | 2,843 | 2,608 | 748 | 1,692 | na | na | na | 10,221 | |
| Total dwelling units (no.) | 3,808 | 3,797 | 3,648 | 980 | 2,114 | 242 | 79 | 140 | 15,022 | |
| Percentage change from previous month | | | | | | | | | | |
| Private sector houses (%) | -0.7 | -2.4 | 0.6 | -0.6 | 1.3 | na | na | na | -0.8 | |
| Total dwelling units (%) | -1.7 | -1.7 | -1.4 | 0.1 | 1.2 | -0.3 | -3.5 | -4.1 | -1.3 | |
| |
| na not available |
| | | | | | | | | | | |
STATE TRENDS
NEW SOUTH WALES
The trend estimate for total dwelling units approved in New South Wales has fallen for the last four months, following four months of growth. The trend for private sector houses has fallen for the last five months.
VICTORIA
The trend estimate for total dwelling units approved in Victoria is now showing falls in the last five months, following six months of growth. The trend for private sector houses has fallen for the last four months.
QUEENSLAND
The trend estimate for total dwelling units approved in Queensland has fallen for the last three months, following six months of growth. The trend for private sector houses has risen for the last eleven months.
SOUTH AUSTRALIA
The trend estimate for total dwelling units approved in South Australia has risen for the last eight months, with the rate of growth now slowing significantly. The trend for private sector houses has fallen for the last three months.
WESTERN AUSTRALIA
The trend estimate for total dwelling units approved in Western Australia has risen for the last eight months, with the rate of growth now slowing. The trend for private sector houses has risen for the last twelve months.
What If...? Revisions to Trend Estimates
Effect of new seasonally adjusted estimates on trend estimates
TREND REVISIONS
Recent seasonally adjusted and trend estimates are likely to be revised when original estimates for subsequent months become available. The approximate effect of possible scenarios on trend estimates are presented below. Generally, the greater the volatility of the original series, the larger the size of the revisions to trend estimates. Analysis of the building approval original series has shown that they can be revised substantially. As a result, some months can elapse before turning points in the trend series are reliably identified.
The graphs and tables which follow present the effect of two possible scenarios on the previous trend estimates: that the January seasonally adjusted estimate is higher than the December estimate by 4% for the number of private sector houses approved and 13% for other dwelling units approved; and that the January seasonally adjusted estimate is lower than the December estimate by 4% for the number of private sector houses approved and 13% for other dwelling units approved. These percentages represent the average absolute monthly percentage change for these series over the last ten years.
PRIVATE SECTOR HOUSES APPROVED
| |
|
| | | | WHAT IF NEXT MONTH‘S SEASONALLY ADJUSTED ESTIMATE:
| |
| | TREND AS PUBLISHED
| (1) rises by 4% on Dec 2003
| (2) falls by 4% on Dec 2003
| |
| | no. | % change | no. | % change | no. | % change | |
| |
| 2003 | | | | | | | |
| August | 10,356 | 1.1 | 10,362 | 1.1 | 10,387 | 1.2 | |
| September | 10,369 | 0.1 | 10,371 | 0.1 | 10,384 | - | |
| October | 10,341 | -0.3 | 10,342 | -0.3 | 10,309 | -0.7 | |
| November | 10,301 | -0.4 | 10,325 | -0.2 | 10,216 | -0.9 | |
| December | 10,221 | -0.8 | 10,315 | -0.1 | 10,110 | -1.0 | |
| 2004 | | | | | | | |
| January | - | - | 10,343 | 0.3 | 10,035 | -0.7 | |
| |
| - nil or rounded to zero (including null cells) |
| | | | | | | | |
|
OTHER DWELLINGS
| |
|
| | | | WHAT IF NEXT MONTH‘S SEASONALLY ADJUSTED ESTIMATE:
| |
| | TREND AS PUBLISHED
| (1) rises by 13% on Dec 2003
| (2) falls by 13% on Dec 2003
| |
| | no. | % change | no. | % change | no. | % change | |
| |
| 2003 | | | | | | | |
| August | 4,821 | 2.4 | 4,819 | 2.5 | 4,856 | 2.9 | |
| September | 4,887 | 1.4 | 4,890 | 1.5 | 4,908 | 1.1 | |
| October | 4,861 | -0.5 | 4,874 | -0.3 | 4,826 | -1.7 | |
| November | 4,766 | -2.0 | 4,781 | -1.9 | 4,621 | -4.2 | |
| December | 4,628 | -2.9 | 4,667 | -2.4 | 4,365 | -5.5 | |
| 2004 | | | | | | | |
| January | - | - | 4,520 | -3.1 | 4,065 | -6.9 | |
| |
| - nil or rounded to zero (including null cells) |
| | | | | | | | |
|
|
 Print Page
 Print All