NOTES
ABOUT THIS PUBLICATION
This publication presents the key results of the Tourism Satellite Account (TSA) for the years 1997-98 to 2003-04. Work on the TSA has been funded by the Department of Industry, Tourism and Resources (DITR).
REVISIONS IN THIS ISSUE
Revisions have been made to earlier year estimates. Some minor revisions to 2002-03 have been made for taxes and margins. These have impacted on estimates of tourism output, tourism value added and tourism GDP. Revisions to estimates of consumption of education by international visitors have been made as a result of updated data from the Department of Education, Science and Training (DEST), impacting on estimates for 2001-02 and 2002-03.
In addition the economy wide national accounting aggregates for 1997-98 to 2002-03 have been revised to make them consistent with the 2003-04 issue of Australian System of National Accounts (cat. no. 5204.0). These revisions impact on ratios of tourism to overall economic activity.
CHANGES IN THIS ISSUE
The 2002-03 release of this publication contained estimates for a new benchmark TSA which allowed for the release of more detailed information in respect of 1997-98 and 2000-01. The 2003-04 publication reflects results from the annual TSA update process where estimates for the latest year are modelled using movements in visitor consumption, and consequently a less detailed set of information is presented.
DATA VALUES AND ROUNDING
All values, unless otherwise indicated, are shown in Australian dollars rounded to the nearest million. Where figures have been rounded, discrepancies may occur between the sums of the component items and totals.
INQUIRIES
For further information about these and related statistics, contact the National Information and Referral Service on 1300 135 070 or Dianne Bourke on Canberra (02) 6252 7243.
ANALYSIS OF RESULTS
KEY RESULTS
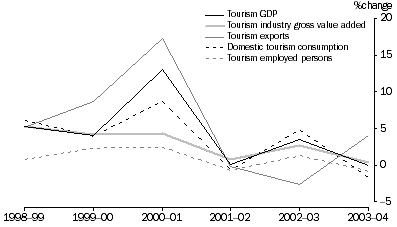
Tourism gross domestic product (GDP) represents the total market value of Australian produced goods and services consumed by visitors after deducting the cost of goods and services used up in the process of production. Tourism accounted for nearly $32 billion of total GDP in 2003-04, a decline in current prices of 0.1% from 2002-03. In contrast total GDP grew by 7.3% in current prices.
The TSA does not present volume estimates so the growth rates in current prices referred to here also reflect the effects of price change. One way around this is to compare the tourism industry's share of GDP over time. In 2003-04 the tourism industry share of GDP was 3.9%, which is the lowest share of GDP since the TSA was first compiled in 1997-98. This is the third consecutive decline since the share peaked in 2000-01.
The high tourism share of GDP in 2000-01 was largely due to price increases in tourism services resulting from the introduction of the Goods and Services Tax (GST) and the impact of the Olympic Games. During 2001-02 and 2002-03 external events such as terrorism and the Severe Acute Respiratory Syndrome (SARS) scare caused a decline in both international visitors to Australia and the willingness of Australians to travel overseas.
In 2003-04 the key factor behind the fall in the tourism share of GDP was that Australians travelled less in Australia and more overseas. This is shown by the 1.7% decline in domestic tourism consumption, whereas total outbound expenditure by Australians travelling overseas rose by 10.6%.
The fall in the share of GDP occurred even though there was a surge in consumption by international visitors of 4% which was driven in part by the conduct of the Rugby World Cup in late 2003.
Selected tourism aggregates
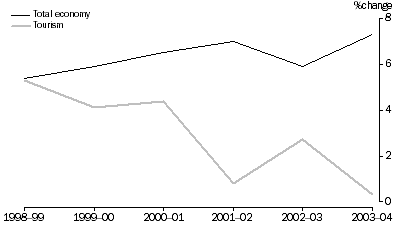
Industry gross value added measures the value of production exclusive of product taxes such as the GST. It is the preferred national accounts measure of the production of industries because it is free from distortions in prices caused by changes in tax rates or the introduction of new taxes. The tourism industry share of total industry gross value added in 2003-04 was 3.5%. This represents the lowest point in the series, having declined from its peak of 4.3% in 1997-98. The tourism industry share for 2003-04 declined because tourism gross value added grew at a slower rate of 0.3% than the very strong growth in gross value added for the whole economy of 7.3%.
Growth in industry gross value added, Current prices
Tourism continues to contribute significantly to employment and Australia's exports. The tourism industry share of total employment declined slightly in 2003-04 to 5.6% compared to its share of 5.9% between 1997-98 and 2000-01. The decrease in the tourism share of employment is because of a decline in tourism employment of 1% compared with a growth in total employment of 1%.
Tourism share of the Australian economy - 2003-04
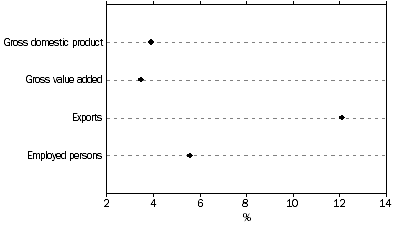
Tourism contributed 12.1% of total exports of goods and services in 2003-04, a proportion higher than for 2002-03 when tourism accounted for 11.2% of exports.
Domestic visitors generated 76% of tourism industry GDP in 2003-04 while international visitors generated 24%. The growth in international tourism consumption has meant that the international contribution to tourism GDP has increased in 2003-04 by 1.2 percentage points at the expense of the domestic visitor share.
TOURISM INDUSTRY GROSS VALUE ADDED
In 2003-04, the industries that accounted for the largest share of tourism gross value added were Air and water transport (14%), Accommodation (11%), Cafes, restaurants and takeaway food outlets (10%), and Other retail trade (9%). These shares have been reasonably steady since 1997-98.
TOURISM GROSS VALUE ADDED, By selected industries |
|  |
 | 1997-98
| 2000-01
| 2003-04
|  |
 | Tourism gross value added | Share of total value added | Tourism gross value added | Share of total value added | Tourism gross value added | Share of total value added |  |
 | $m | % pts | $m | % pts | $m | % pts |  |
|  |
| Air & water transport | 3,211 | 14.7 | 3,727 | 14.9 | 3,521 | 13.5 |  |
| Accommodation | 2,400 | 11.0 | 2,775 | 11.1 | 2,941 | 11.3 |  |
| Cafes, restaurants & takeaway food outlets | 2,209 | 10.1 | 2,501 | 10.0 | 2,599 | 10.0 |  |
| Other retail trade | 2,079 | 9.5 | 2,124 | 8.5 | 2,295 | 8.8 |  |
| All other industries | 11,994 | 54.8 | 13,917 | 55.6 | 14,660 | 56.3 |  |
| Total | 21,894 | 100.0 | 25,044 | 100.0 | 26,016 | 100.0 |  |
|  |
COMPARISON WITH 'NON-TOURISM' INDUSTRIES
Tourism contributed $26 billion to industry gross value added in 2003-04. When compared to the traditional industries published in ABS statistics using Australian and New Zealand Standard Industrial Classification (ANZSIC) divisions, the gross value added of the tourism industry ranks thirteenth out of the seventeen industry divisions. Tourism gross value added exceeded that of Agriculture, forestry and fishing, Communication services, Electricity, gas and water supply, Personal and other services, Accommodation, cafes and restaurants, and Cultural and recreational services.
TOURISM CONSUMPTION
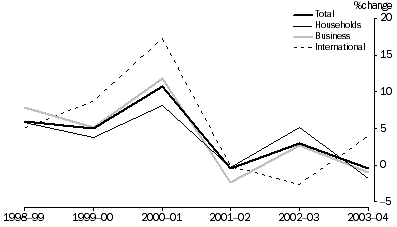
Total tourism consumption declined by 0.4% in 2003-04 after a rise of 3% in 2002-03. This occurred because domestic travel consumption declined, despite an increase in consumption by international visitors. Tourism consumption by domestic households fell from $48.2 billion to $47.4 billion in 2003-04, a decline of 1.8%. Similarly, consumption by business and government went from $8.4 billion to $8.3 billion in 2003-04, a decrease of 1%. International visitor consumption rose by 4% to $17.3 billion in 2003-04.
Tourism consumption recorded its strongest growth during 2000-01 of 10.7%, which mainly reflects the impact of GST on the price of services and expenditure on Olympic tickets. (See following graph.)
Growth in tourism consumption
Tourism consumption of most products declined during 2003-04. The largest decreases occurred for Fuel (down 5%), Long distance passenger transport, Takeaway and restaurant meals and Alcoholic and other beverages (all down 3%). All of these products are significant contributors to total tourism consumption.
The products for which tourism consumption increased between 2002-03 and 2003-04 were Education (up 13%), Gambling and betting services (up 12%), and Recreational, cultural and sports services (up 8%). Consumption of these three products increased for both domestic and international visitors.
Domestic visitors contributed 76% of total tourism consumption in 2003-04 while the international visitor contribution was 24%. Of all domestic visitors, domestic households accounted for 85% and domestic business/government accounted for 15%.
The bulk of domestic tourism consumption was by those visitors who stayed away overnight (78%), with day visitors accounting for the remainder (22%).
In 2003-04 the greatest tourism consumption by product occurred for Long distance passenger transportation and Shopping, including gifts and souvenirs (16% each), followed by Takeaway and restaurant meals (15%) and then Accommodation services (10%).
However, there are some marked differences in consumption patterns by type of visitor. Long distance passenger transportation is the dominant tourism product consumed by domestic business and government (41%) and international visitors (26%). In contrast, domestic household visitor consumption is dominated by Shopping, including gifts and souvenirs (20%), and Takeaway and restaurant meals (19%).
SHARE OF TOURISM CONSUMPTION, Selected tourism products - By type of visitor - 2003-04 |
|  |
 | Households | Business/ government | International | All visitors |  |
 | % | % | % | % |  |
|  |
| Long distance passenger transportation | 8.6 | 40.8 | 26.2 | 16.5 |  |
| Shopping (including gifts & souvenirs) | 19.8 | 0.3 | 13.2 | 16.0 |  |
| Takeaway & restaurant meals | 19.0 | 6.2 | 7.5 | 14.8 |  |
| Accommodation services | 6.7 | 20.6 | 13.6 | 9.9 |  |
| Food products | 9.6 | 0.6 | 7.0 | 8.0 |  |
| Fuel (petrol, diesel) | 7.0 | 15.7 | 1.2 | 6.6 |  |
| Taxi products | 0.4 | 3.1 | 0.7 | 0.8 |  |
| All other tourism products | 28.9 | 12.6 | 30.5 | 27.4 |  |
| Total | 100.0 | 100.0 | 100.0 | 100.0 |  |
|  |
INTERNATIONAL TRADE IN TOURISM
Tourism makes an important contribution to Australia's export earnings. In 2003-04, international visitors consumed $17.3 billion worth of goods and services produced by the Australian economy. This represented 12.1% of the total exports of goods and services. While tourism exports grew quite strongly between 1997-98 and 2000-01, so did exports of other goods and services. However, in 2003-04 tourism exports increased by 4%, while total exports declined by 3% thus leading to an increase in the tourism share.
EXPORTS OF TOURISM GOODS AND SERVICES |
|  |
 | 1997-98 | 1998-99 | 1999-00 | 2000-01 | 2001-02 | 2002-03 | 2003-04 |  |
|  |
| International visitor consumption ($m) | 12,792 | 13,445 | 14,610 | 17,140 | 17,107 | 16,656 | 17,317 |  |
| Total exports ($m) | 113,744 | 112,025 | 126,222 | 153,763 | 153,200 | 148,293 | 143,366 |  |
| Tourism share of exports (%) | 11.2 | 12.0 | 11.6 | 11.1 | 11.2 | 11.2 | 12.1 |  |
| Growth in international visitor consumption (%) | . . | 5.1 | 8.7 | 17.3 | -0.2 | -2.6 | 4.0 |  |
| Growth in total exports (%) | . . | -1.5 | 12.7 | 21.8 | -0.4 | -3.2 | -3.3 |  |
|  |
| . . not applicable |
Exports of tourism goods and services compare favourably with Australia's 'traditional' export products. For example, exports of tourism products are greater than coal, or iron, steel and non-ferrous metals, but less than food and live animals.
SELECTED EXPORT COMMODITIES, Percentage of total exports |
|  |
 | 1997-98 | 1998-99 | 1999-00 | 2000-01 | 2001-02 | 2002-03 | 2003-04 |  |
 | % | % | % | % | % | % | % |  |
|  |
| Coal, coke and briquettes | 8.4 | 8.3 | 6.6 | 7.1 | 8.8 | 8.1 | 7.7 |  |
| Iron, steel, non-ferrous metals | 6.3 | 6.2 | 7.0 | 6.6 | 6.3 | 5.9 | 5.4 |  |
| Food and live animals | 14.1 | 13.8 | 13.4 | 13.5 | 14.6 | 12.4 | 12.8 |  |
| Tourism products and services | 11.2 | 12.0 | 11.6 | 11.1 | 11.2 | 11.2 | 12.1 |  |
|  |
| International Trade in Goods and Services, Australia (cat. no. 5368.0). |
TOURISM EMPLOYED PERSONS
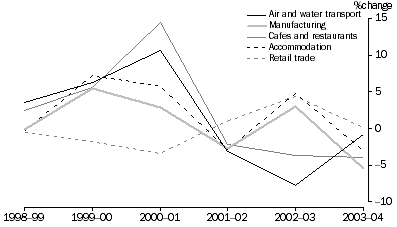
The tourism industry employed 536,600 persons in 2003-04. The number of tourism employed persons grew 5.5% between 1997-98 and 2003-04, slower than the growth in total employed persons (11.1%) over that period. Consequently, the tourism share of total employed persons fell from 5.9% in 1997-98 to 5.6% in 2003-04.
The tourism share of total employment is higher than the tourism share of industry gross value added. This is because tourism tends to be generally more labour intensive than other forms of economic activity.
The Retail trade industry generated the most tourism employment (26% of total tourism employment). The Retail trade, Accommodation, and the Cafes and restaurants industries account for more that half of the employment generated by tourism.
Growth in tourism employed persons, By selected industries
VISITOR NUMBERS
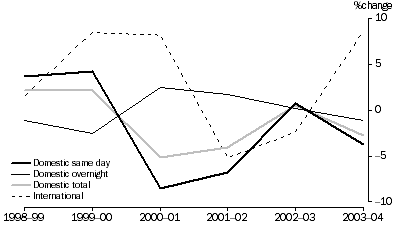
Trips by domestic visitors declined in 2003-04 by 2.8%. The number of overnight trips decreased by 1% while the number of day trips decreased by 4%.
There were over 5 million short term international visitor arrivals to Australia during 2003-04 - the highest level ever. This represents the first annual increase since the previous peak which occurred during 2000-01. During 2001-02 and 2002-03 there were declines of 5% and 2% respectively.
Growth in visitor numbers
 Print Page
 Print All