SEPTEMBER KEY FIGURES
 | Jun Qtr 07 to Sep Qtr 07 | Sep Qtr 06 to Sep Qtr 07 |
| STAGE OF PRODUCTION | % change | % change |
|
| Final (Stage 3) commodities (excl. exports) | 1.1 | 2.4 |
| Domestic | 1.5 | 3.7 |
| Imports | -1.5 | -5.5 |
| Intermediate (Stage 2) commodities | 1.1 | 3.2 |
| Domestic | 1.4 | 4.5 |
| Imports | -0.3 | -4.4 |
| Preliminary (Stage 1) commodities | 1.0 | 2.6 |
| Domestic | 1.1 | 3.6 |
| Imports | 0.7 | -3.9 |
|
Final Stage, Base: 1998-99 = 100.0
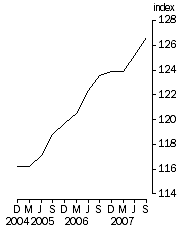
| Final Stage, Quarterly % change
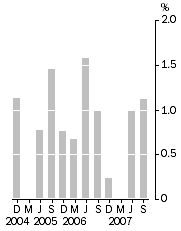
|
SEPTEMBER KEY POINTS
FINAL (STAGE 3) COMMODITIES
- increased by 1.1% in the September quarter 2007
- mainly due to price increases in building construction (+1.4%) and other agriculture (+15.4%)
- partially offset by price falls in petroleum refining (-2.9%) and electronic equipment manufacturing (-4.6%)
- rose by 2.4% through the year to September quarter 2007
INTERMEDIATE (STAGE 2) COMMODITIES
- increased by 1.1% in the September quarter 2007
- mainly due to price increases in grain, sheep, beef and dairy cattle farming (+10.5%), and property operators and developers (+3.4%)
- partially offset by price decreases in basic non-ferrous metal manufacturing (-10.0%) and coal mining (-15.1%)
- rose by 3.2% through the year to September quarter 2007
PRELIMINARY (STAGE 1) COMMODITIES
- increased by 1.0% in the September quarter 2007
- mainly due to price increases in property operators and developers (+3.4%), and grain, sheep, beef and dairy cattle farming (+7.7%)
- partially offset by price falls for basic non-ferrous metal manufacturing (-10.0%) and coal mining (-15.1%)
- rose 2.6% through the year to September quarter 2007
NOTES
FORTHCOMING ISSUES
| ISSUE (QUARTER) | Release Date |
| December 2007 | 21 January 2008 |
| March 2008 | 21 April 2008 |
ROUNDING
Any discrepancies between totals and sums of components in this publication are due to rounding.
CHANGES IN THIS ISSUE
There are no changes in this issue.
FORTHCOMING CHANGES
Price indexes for the output of the general construction industry will be calculated with a new weighting pattern commencing in the December Quarter 2007 issue of Producer Price Indexes, Australia (cat. no. 6427.0). There are no changes in this issue.
The ABS will publish an information paper on 14 January 2008 that will show the new weighting pattern and provide information on the methods used to compile the indexes.
RELATED STATISTICS
For more information about statistics in this publication contact Lee Taylor on Canberra (02) 6252 6251, or email <lee.taylor@abs.gov.au>.
INQUIRIES
For further information about these and related statistics, contact the National Information and Referral Service on 1300 135 070 or Lee Taylor on Canberra (02) 6252 6251.
SUMMARY COMMENTARY
STAGE OF PRODUCTION (SOP) OVERVIEW
Each of the three stages of production indexes increased in the September quarter 2007. The final (stage 3) index recorded a 1.1% increase in the September quarter 2007. The intermediate (Stage 2) index also increased by 1.1% with an increase of 1.0% for the preliminary (Stage 1) index. Through the year to September quarter 2007, the final (Stage 3) index increased by 2.4%, the intermediate (Stage 2) increased by 3.2% and the preliminary (Stage 1) index increased by 2.6%.
The increase in the final (Stage 3) index reflects an increase of 1.5% in the price of domestically produced items, offset by a fall of 1.5% in the price of imported items. The domestic component increased due to price rises for building construction (+1.4%), other agriculture (+15.4%) and electricity, gas and water supply (+5.0%), partially offset by price falls in petroleum refining (-1.9%) and bakery product manufacturing (-2.9%). The imports component decreased due to price falls for electronic equipment manufacturing (-5.1%), other manufacturing (-4.8%), and petroleum refining (-9.9%), partially offset by price increases in other food manufacturing (+2.7%).
The increase of 1.1% in the intermediate (Stage 2) index reflects an increase of 1.4% in the price of domestically produced items and a decrease of 0.3% in the price of imported items. The domestic component increased due to price rises for grain, sheep, beef and dairy cattle farming (+10.5%), and property operators and developers (+3.4%), partially offset by price falls in basic non-ferrous metal manufacturing (-10.6%) and coal mining (-15.1%). The imports component decreased due to price falls for industrial machinery and equipment manufacturing (-2.6%), and motor vehicle and part manufacturing (-2.5%), partially offset by price increases in oil and gas extraction (+5.1%).
The increase of 1.0% in the preliminary (Stage 1) index reflects an increase of 1.1% in the price of domestically produced items and an increase of 0.7% in the price of imported items. The domestic component increased due to price rises for property operators and developers (+3.4%), grain, sheep, beef and dairy cattle farming (+7.7%), and electricity, gas and water supply (+5.3%), partially offset by price decreases in basic non-ferrous metal manufacturing (-10.6%) and coal mining (-15.1%). The imports component increased due to price rises for oil and gas extraction (+5.1%), iron and steel manufacturing (+6.4%) and other mining (+31.1%). Partially offsetting these were price falls in industrial machinery and equipment manufacturing (-2.7%), and petroleum refining (-3.6%).
COMPARISION OF SOP INDEXES: Base: 1998-99 = 100.0

MANUFACTURING INDUSTRIES PRODUCER PRICE INDEXES
During the September quarter 2007, the prices paid by manufacturers for material inputs increased by 1.3 %, while the prices they received for their outputs decreased by -0.4%. Through the year to September quarter 2007, prices of material inputs increased by 1.0% while prices for their outputs rose 0.8%.
Price rises in outputs from dairy cattle farming (+28.0%), metal ore mining (+4.0%), grain, sheep and beef cattle farming (+2.9%) and other crop growing (+3.9%) drove the rise in the cost of materials used in the manufacturing industries. Contributors to these price increases were whole milk, lead ores and concentrates, cattle and calves and wheat and meslin unmilled. Price decreases for outputs from oil and gas extraction (-1.2%), basic chemical manufacturing (-3.9%) and coal mining (-15.1%) provided offsets to the price increases.
The decrease in prices received for articles produced by manufacturing industries was mainly due to falls in the price of outputs from basic non-ferrous metal manufacturing - driven by lower global nickel prices, other food manufacturing, and bakery product manufacturing. These decreases were partly offset by increases in the prices received for outputs from petroleum refining, dairy product manufacturing, and basic chemicals manufacturing. Contributors to these price increases were price rises in diesel, milk and fertilizers.
MATERIALS USED IN MANUFACTURING INDUSTRIES, All Groups: Quarterly % change
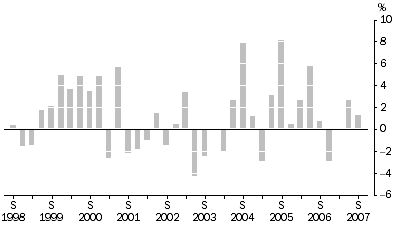
ARTICLES PRODUCED BY MANUFACTURING INDUSTRIES, All groups: Quarterly % change

CONSTRUCTION INDUSTRIES PRODUCER PRICE INDEXES
The price index for materials used in house building increased by 0.9% in the September quarter 2007. This follows consecutive price increases of 0.5% in the March quarter 2007 and 0.6% in the June quarter 2007. The most significant contributors to the price increases were timber, board and joinery (+1.3%), other metal products (+1.2%) and ceramic products (+1.0%). These price increases were partially offset by falls in prices of electrical equipment (-0.7%) and concrete, cement and sand (-0.3%).
Melbourne (+0.8%) contributed the most to the overall weighted average of six capital cities quarterly movement with increases recorded for all the state capitals, ranging from 0.2% in Sydney to 1.5% in Hobart.
Through the year to September quarter 2007, the materials used in house building price index rose by 2.7%.
MATERIALS USED IN HOUSE BUILDING, All groups: Quarterly % change
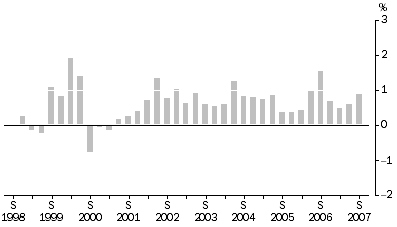
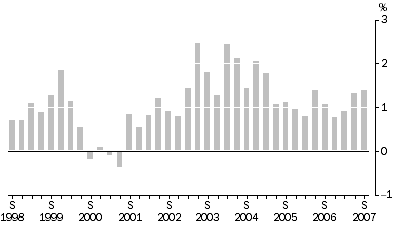
The price index for the output of the general construction industry increased by 1.4% in the September quarter 2007, and by 4.5% through the year to September quarter 2007. Increases were registered in the quarter for all component industries. The largest contributor this quarter was the index for non-residential building construction (+1.5%), followed by house construction (+1.2%), other residential building construction (+1.3%) and road and bridge construction (+1.7%).
Demand for trades and services across regions continues to drive general construction price movements this quarter. Materials and labour cost increases were less significant factors in price movements, however shortages of professional staff were noted to have an impact on building construction prices (+1.4%) and material input costs were noted to contribute to some of the increase in road and bridge construction prices (+1.7%).
With an increase of 1.8% for the September quarter 2007, Victoria made the largest contribution to the quarterly movement of the price index of the general construction industry. This was largely due to an increase in non-residential building construction prices (+2.5%). New South Wales also made a large contribution with an increase of 0.9%, influenced by house construction prices (+1.3%). Queensland contributed significantly with an increase of 1.5%, as did Western Australia with an increase of 1.8%.
OUTPUT OF THE GENERAL CONSTRUCTION INDUSTRY, All groups: Quarterly % change
SERVICE INDUSTRIES PRODUCER PRICE INDEXES
The property and business services industries price index increased by 2.6% in the September quarter 2007, and by 6.1% through the year to September quarter 2007.
The property services price index increased by 3.5% in the September quarter 2007, and by 9.7% through the year to September quarter 2007. The main contributors to the increase were commercial property operators and developers (+3.4%) and real estate agents (+4.8%). The business services index increased by 1.8% in the September quarter 2007 and by 3.7% through the year to September quarter 2007. The main contributors to the increase were legal services (+5.0%), consultant engineering services (+8.0%), accounting services (+2.7%) and contract staff services (+1.5%).
PROPERTY AND BUSINESS SERVICES INDUSTRIES, All groups: Quarterly % change

The transport (freight) and storage industries index increased by 0.6% in the September quarter 2007, and by 0.3% through the year to September quarter 2007. The most significant contributors to the increase were road freight transport (+1.1%), parking services (+4.4%), services to air transport (+2.4%) and coastal water transport (+2.4%). These increases were partly offset by decreases in rail transport (-2.6%) and international sea transport (-1.6%).
TRANSPORT (FREIGHT) AND STORAGE INDUSTRIES, All groups: Quarterly % change

 Print Page
 Print All