|
|
JANUARY KEY FIGURES
 | Jan 05 | Dec 04 to Jan 05 | Jan 04 to Jan 05 | |
| no. | % change | % change | |
Trend | |
| |
| Total dwelling units approved | 12,602 | - | -14.4 | |
| Private sector houses | 8,592 | - | -12.8 | |
| Private sector other dwellings | 3,615 | 0.3 | -20.7 | |
Seasonally Adjusted | |
| |
| Total dwelling units approved | 13,246 | 1.7 | -9.0 | |
| Private sector houses | 8,881 | 8.4 | -8.9 | |
| Private sector other dwellings | 4,007 | -10.1 | -11.4 | |
| |
| - nil or rounded to zero (including null cells) |
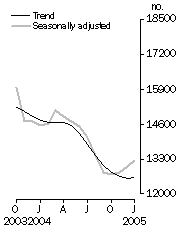
Dwelling units approved, Total number
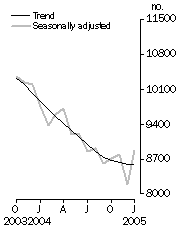
| Private sector houses approved, Total number
|
JANUARY KEY POINTS
TOTAL DWELLING UNITS
- The trend estimate for total dwellings has flattened, with the estimate for January 2005 virtually unchanged from December 2004. This follows eight months of decline.
- The seasonally adjusted estimate for total dwelling units approved rose 1.7%, to 13,246, in January 2005.
PRIVATE SECTOR HOUSES
- Following falls over the previous fifteen months, the trend estimate for private sector houses was flat in January 2005.
- The seasonally adjusted estimate for private sector houses approved rose 8.4%, to 8,881, in January 2005, following a fall of 6.8% in December 2004.
PRIVATE SECTOR OTHER DWELLING UNITS
- The trend estimate for private sector other dwellings approved rose marginally (+0.3%) in January 2005, after seven months of decline.
- The seasonally adjusted estimate for private sector other dwellings approved fell 10.1%, to 4,007, in January 2005, following a rise of 27.5% in December 2004.
VALUE OF BUILDING APPROVED
- The seasonally adjusted estimate of the value of total building approved rose 0.8%, to $4,258.6m, in January 2005. The value of new residential building approved fell 3.8%, to $2,448.7m.
NOTES
CHANGES IN THIS ISSUE
There are no changes in this issue.
REVISIONS THIS MONTH
Revisions have been made to total dwelling units in this issue:
| 2003-04 | 2004-05 | TOTAL |
|
| New South Wales | 161 | -9 | 152 |
| Victoria | 15 | -6 | 9 |
| Queensland | 39 | 14 | 53 |
| South Australia | - | -106 | -106 |
| Western Australia | - | 29 | 29 |
| Tasmania | - | -1 | -1 |
| Northern Territory | - | 1 | 1 |
| Australian Capital Territory | - | -20 | -20 |
| TOTAL | 215 | -98 | 117 |
|
A previously unreported approval has resulted in an increase of $77m to non-residential building in Queensland for December 2004.
DATA NOTES
Estimates have been included in this issue for three councils unable to report all building work approved in their municipalities this month (Campbelltown and Canada Bay in New South Wales, and Pine Rivers in Queensland).
INQUIRIES
For further information about these and related statistics, contact the National Information and Referral Service on 1300 135 070 or David Finlay on Adelaide (08) 8237 7431.
VALUE OF BUILDING APPROVED
NEW RESIDENTIAL BUILDING
The trend estimate of the value of new residential building is showing a rise over the past three months after six months of decline. The trend rose 1.0% in January 2005.
ALTERATIONS AND ADDITIONS TO RESIDENTIAL BUILDING
The trend estimate of the value of alterations and additions to residential building is now showing a rise over the past three months. The trend rose 0.8% in January 2005.
NON-RESIDENTIAL BUILDING
The trend estimate of the value of non-residential building is now showing five months of decline, falling 4.2% in January 2005.
DWELLINGS APPROVED
TOTAL DWELLING UNITS
The trend estimate for total dwelling units approved was flat in January 2005 following a general decline starting in 2003.
PRIVATE SECTOR HOUSES
The trend estimate for private sector houses approved is now flat after declining for the previous fifteen months.
PRIVATE SECTOR OTHER DWELLINGS
The trend estimate for private sector other dwellings approved rose 0.3% in January 2005 after falling for the previous seven months.
DWELLING UNITS APPROVED STATES AND TERRITORIES
SUMMARY COMMENTS
The trend estimate for total dwelling units approved was flat in January 2005. The trend rose in all states and territories except Victoria (-2.3%), Queensland (-0.7%) and the Northern Territory (-7.7%).
The trend estimate for private sector houses approved was flat in January 2005. The trend continued to fall in New South Wales (-1.1%), Victoria (-0.1%) and Queensland (-1.6%) but rose in South Australia (+2.0%) and Western Australia (+2.8%).
| | NSW | Vic. | Qld | SA | WA | Tas. | NT | ACT | Aust. | |
Original | |
| |
| Dwelling units approved | | | | | | | | | | |
| Private sector houses (no.) | 1,206 | 1,864 | 1,615 | 470 | 1,512 | 162 | 22 | 28 | 6,879 | |
| Total dwelling units (no.) | 2,314 | 2,315 | 2,627 | 982 | 1,671 | 193 | 82 | 481 | 10,665 | |
| Percentage change from previous month | | | | | | | | | | |
| Private sector houses (%) | -20.6 | -7.3 | -4.7 | -35.1 | -1.4 | -19.4 | -15.4 | -61.1 | -11.6 | |
| Total dwelling units (%) | -26.3 | -18.7 | -14.3 | 11.6 | -14.5 | -25.5 | -2.4 | -11.6 | -16.5 | |
Seasonally Adjusted | |
| |
| Dwelling units approved | | | | | | | | | | |
| Private sector houses (no.) | 1,517 | 2,634 | 2,034 | 681 | 1,751 | na | na | na | 8,881 | |
| Total dwelling units (no.) | 3,111 | 3,085 | 3,067 | 1,193 | 1,983 | 227 | na | na | 13,246 | |
| Percentage change from previous month | | | | | | | | | | |
| Private sector houses (%) | -0.2 | 22.3 | 7.0 | -4.8 | 9.1 | na | na | na | 8.4 | |
| Total dwelling units (%) | 4.2 | 3.2 | -7.3 | 36.8 | -0.3 | -8.1 | na | na | 1.7 | |
Trend | |
| |
| Dwelling units approved | | | | | | | | | | |
| Private sector houses (no.) | 1,508 | 2,427 | 2,015 | 694 | 1,675 | na | na | na | 8,592 | |
| Total dwelling units (no.) | 2,907 | 3,144 | 3,147 | 836 | 1,929 | 242 | 84 | 313 | 12,602 | |
| Percentage change from previous month | | | | | | | | | | |
| Private sector houses (%) | -1.1 | -0.1 | -1.6 | 2.0 | 2.8 | na | na | na | - | |
| Total dwelling units (%) | 0.8 | -2.3 | -0.7 | 0.5 | 0.4 | 0.4 | -7.7 | 30.4 | - | |
| |
| - nil or rounded to zero (including null cells) |
| na not available |
DWELLING UNITS APPROVED
State Trends
NEW SOUTH WALES
The trend estimate for total dwelling units approved in New South Wales rose 0.8% in January 2005 after falling for the previous nine months. The trend for private sector houses is showing declines for the last seventeen months.
VICTORIA
The trend estimate for total dwelling units in Victoria is showing a decline over the past fifteen months. The trend for private sector houses shows a decline over the past seventeen months with the rate of decline slowing in recent months.
QUEENSLAND
The trend estimate for total dwelling units approved in Queensland is showing a general decline over the last sixteen months. The trend for private sector houses is now showing a decline over the last fifteen months.
SOUTH AUSTRALIA
The trend estimate for total dwelling units approved in South Australia is now showing a rise after six months of decline. The trend for private sector houses is now showing a rise over the past four months.
WESTERN AUSTRALIA
The trend estimate for total dwelling units approved in Western Australia now shows a rise in the last two months after six months of decline. The trend for private sector houses shows a rise over the past five months.
|
 Print Page
 Print All