MARCH KEY FIGURES
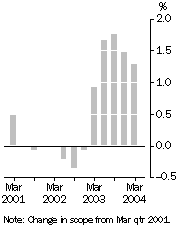
Inventories (volume terms), Trend estimates - Quarterly change
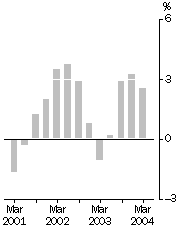
| Company gross operating profits (current prices), Trend estimates - Quarterly change
|
MARCH KEY POINTS
TREND ESTIMATES
- The trend estimate (in volume terms) for inventories for the March quarter 2004 is $99,424m, an increase of 1.3% over the December quarter. The trend estimate (in volume terms) for sales of goods and services in Manufacturing has increased in the latest three quarters while Wholesale trade's sales of goods and services has continued the increases since March quarter 2001. The trend estimate (in current price terms) for company gross operating profits grew by 2.5% this quarter.
SEASONALLY ADJUSTED ESTIMATES
- The seasonally adjusted estimate (in volume terms) for inventories increased by 2.2% in the March quarter 2004, with Wholesale trade the major contributor. Sales of goods and services in Manufacturing and Wholesale trade both increased, by 1.8% and 3.4%, respectively.
- Company gross operating profits decreased by 1.9% this quarter, with all industries other than Manufacturing, Wholesale and Retail trade decreasing.
NOTES
COMPARISON BETWEEN COMPANY GROSS OPERATING PROFITS AND GROSS OPERATING SURPLUS
In recent quarters price changes have led to a significant inventories valuation adjustment being applied in calculating the gross operating surplus estimate in the Australian National Accounts. As a result, the company gross operating profits estimate in this publication has not been a reliable indicator for gross operating surplus. The inventories valuation adjustment in the current quarter is relatively insignificant, however, and so differences in company gross operating profits and gross operating surplus will be less than in recent quarters.
REVISIONS IN THIS ISSUE
As is usually the case after the initial release of a quarter's estimates, revisions have been made to the December quarter 2003 estimates as a result of responses received or revised after the publication of the previous issue. The net effect on December quarter 2003 estimates of these revisions has been to adjust the seasonally adjusted chain volume estimates for total inventories by +0.3%, Manufacturing sales of goods and services by +0.9% and wholesale trade sales of goods and services by +1.2%; seasonally adjusted current price estimates for company gross operating profits by -0.4%; and original current price estimates for wages and salaries by +0.9%.
CHANGES IN THIS ISSUE
See 'Changes in this issue' section on page 3 for further details.
CHANGES IN THE NEXT ISSUE
See 'Changes in the next issue' section on page 4 for further details.
INQUIRIES
For further information about these and related statistics, contact the National Information and Referral Service on 1300 135 070 or Mark Wise on Sydney (02) 9268 4241.
CHANGES IN THIS ISSUE
EXPERIMENTAL SEASONALLY ADJUSTED ESTIMATES
The introduction of the Quarterly Business Indicators Survey (QBIS) in March quarter 2001 commenced the collection of some series which were not previously collected in the surveys QBIS replaced. As these series have now been collected for 3 years, it is possible to produce seasonally adjusted and trend estimates for the first time. These new seasonally adjusted and trend estimates should, however, be regarded as experimental until at least 5 years of data are available.
Seasonally adjusted and trend estimates for sales of goods and services are now available for Mining, Construction and Other selected industries. These are produced in current price and volume terms and are included in Tables 1 to 3 of this release.
Seasonally adjusted and trend estimates for wages and salaries are available for all industries and are included in Tables 13 and 14 of this issue. While the QBIS estimates of wages and salaries are used as a partial indicator for compensation of employees in the Australian National Accounts, users should exercise caution when comparing these series. Differences in seasonally adjusted level and movement estimates are mainly caused by the following two factors:
- The scopes are different: the industry scope of the QBIS estimate is narrower than that used in the Australian National Accounts; and QBIS only produces estimates with respect to the private sector; and
- The time series for compensation of employees is much longer than that available from QBIS. The short QBIS time series may affect the quality of its seasonally adjusted estimates until at least 5 years of data are available.
In the next issue of this publication, the wages and salaries estimates shown in the key figures of page 1 will be the experimental seasonally adjusted estimates, and not the original estimates as currently shown.
More information is provided in Paragraphs 31 and 32 of the Explanatory Notes.
Seasonally adjusted and trend estimates for sales of goods and services and wages and salaries by state will be released in a later issue of this publication.
SAMPLING ERROR ANNOTATIONS
Estimates that have an estimated relative standard error between 10% and 25% are annotated with the symbol '^' . These estimates should be used with caution as they are subject to sampling variability too high for some purposes. Estimates with an RSE between 25% and 50% are annotated with the symbol '*', indicating that the estimate should be used with caution as it is subject to sampling variability too high for most practical purposes. Estimates with an RSE greater than 50% are annotated with the symbol '**' indicating that the sampling variability causes the estimates to be considered too unreliable for general use. These annotations have only been applied to estimates from the September quarter 2003 and only relate to level estimates in original, current price terms.
SALES OF GOOD AND SERVICES
"Income from sales of goods and services" is now referred to as "Sales of goods and services". The concept remains the same as that used in previous issues.
CHANGES IN THE NEXT ISSUE
As discussed in Paragraph 7 of the Explanatory Notes, inventories are not directly collected from businesses with less than 20 employees. From the June quarter 2004 issue, a revised methodology for modelling these estimates will be introduced. The new methodology uses a similar modelling technique as at present to derive an inventories value for each individual small business when it is first included in the collection. Following the ABS's policy of planned rotation, most small businesses remain in the collection for 12 quarters and the key feature of the new methodology is that this initial value will be retained each quarter for each business until it is rotated out of the survey. The current methodology re-estimates the inventory value for the small businesses each quarter, which causes volatility in the series that has to be managed. Studies indicate that this more closely represents the inventories management practices of small businesses except that the value of these inventories holdings would change over time as purchase prices change. While it is theoretically possible to build price changes into the new methodology, the impact of not revaluing this initial figure for each individual business is not expected to have any significant impact on the time series.
INDUSTRY TREND ESTIMATES
TOTAL ALL INDUSTRIES
COMPANY GROSS OPERATING PROFITS
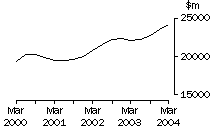
The current price trend estimate for total company gross operating profits increased in the latest four quarters.
INVENTORIES
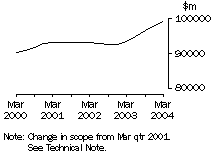
The trend estimate for total inventories (in volume terms) increased 2.2% in the latest quarter. This continued the build up throughout 2003, with Wholesale trade being the main driver.
MINING
COMPANY GROSS OPERATING PROFITS
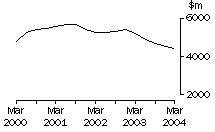
The current price trend estimate for company gross operating profits declined steadily over the last five quarters.
INVENTORIES
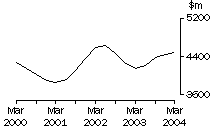
The trend estimate for inventories (in volume terms) increased for the fourth successive quarter.
MANUFACTURING
COMPANY GROSS OPERATING PROFITS
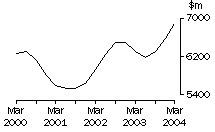
The current price trend estimate for company gross operating profits increased in the last three quarters after three quarters in decline.
INVENTORIES
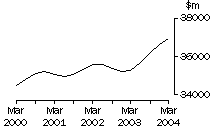
The trend estimate for inventories (in volume terms) increased steadily in the last five quarters.
Sales of goods and services
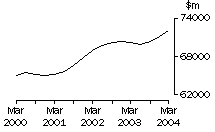
The trend estimate for sales of goods and services (in volume terms) increased over the last three quarters after decreasing in the previous two quarters.
CONSTRUCTION
COMPANY GROSS OPERATING PROFITS
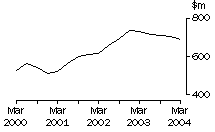
The current price trend estimate for company gross operating profits fell in the last five quarters after peaking in December 2002.
WHOLESALE TRADE
COMPANY GROSS OPERATING PROFITS
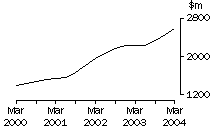
The current price trend estimate for company gross operating profits grew very strongly in the last three quarters after being relatively flat in the preceding three quarters.
INVENTORIES
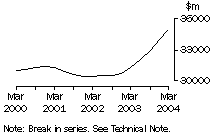
The trend estimate for inventories (in volume terms) has continued the strong build up which commenced in June quarter 2002.
Sales of goods and services
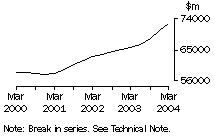
The trend estimate for sales of goods and services (in volume terms) has grown steadily since December 2000.
RETAIL TRADE
COMPANY GROSS OPERATING PROFITS
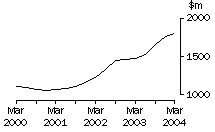
The current price trend estimate for company gross operating profits grew quite strongly over the last three quarters.
INVENTORIES
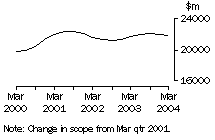
The trend estimate for inventories (in volume terms) decreased in the latest two quarters after four quarters of increases.
Sales of goods and services
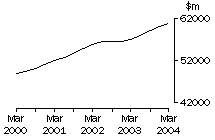
The trend estimate for sales of goods and services (in volume terms) grew steadily this quarter continuing the growth present since December quarter 2002.
TRANSPORT AND STORAGE
COMPANY GROSS OPERATING PROFITS
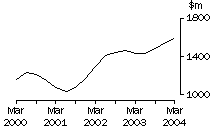
The current price trend estimate for company gross operating profits grew steadily over the last three quarters after being relatively flat throughout 2002-03.
Sales of goods and services
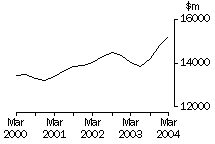
The trend estimate for sales of goods and services (in volume terms) increased strongly in the latest two quarters after falls in the previous three quarters.
PROPERTY AND BUSINESS SERVICES
COMPANY GROSS OPERATING PROFITS
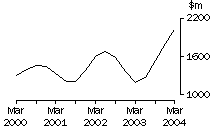
The current price trend estimate for company gross operating profits increased strongly for the fourth successive quarter.
Sales of goods and services
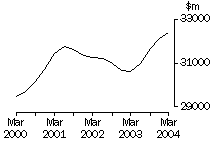
The trend estimate for sales of goods and services (in volume terms) increased in the latest four quarters after falling for the previous seven quarters.
 Print Page
 Print All