JANUARY KEY FIGURES
 |  | Jan 08 | Dec 07 to Jan 08 | Jan 07 to Jan 08 |
 |  | no. | % change | % change |
|
| TREND |  |  |  |
 | Total dwelling units approved | 13 463 | -0.6 | 7.2 |
 | Private sector houses | 9 081 | -0.4 | 5.9 |
 | Private sector other dwellings | 4 003 | -0.7 | 9.9 |
| SEASONALLY ADJUSTED |  |  |  |
 | Total dwelling units approved | 13 166 | 1.9 | 5.1 |
 | Private sector houses | 9 034 | 2.7 | 6.1 |
 | Private sector other dwellings | 3 671 | -2.6 | -0.5 |
|
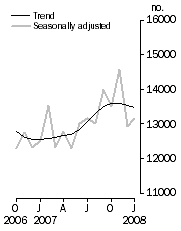
Dwelling units approved

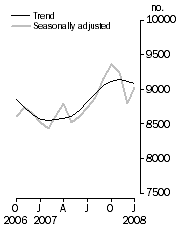
| Private sector houses approved

|
JANUARY KEY POINTS
TOTAL DWELLING UNITS
- The trend estimate for total dwelling units approved fell 0.6% in January 2008.
- The seasonally adjusted estimate for total dwelling units approved rose 1.9% in January following a revised fall of 11.3% in December.
PRIVATE SECTOR HOUSES
- The trend estimate for private sector houses approved fell 0.4% in January following a revised fall of 0.2% in December.
- The seasonally adjusted estimate for private sector houses approved rose 2.7% in January following a revised fall of 4.8% in December.
PRIVATE SECTOR OTHER DWELLING UNITS
- The trend estimate for private sector other dwellings approved fell 0.7% in January.
- The seasonally adjusted estimate for private sector other dwellings approved fell 2.6% in January.
VALUE OF BUILDING APPROVED
- The trend estimate for the value of total building approved rose 0.9% in January. The trend estimate for the value of new residential building approved rose 0.7% and the value of alterations and additions rose 0.1%. The value of non-residential building approved rose 1.5%.
- The seasonally adjusted estimate for the value of total building approved rose 15.7% in January. The seasonally adjusted estimate for the value of new residential building approved fell 1.4% in January. The seasonally adjusted estimate for the value of alterations and additions rose 8.1% and the value of non-residential building rose 40.9%.
NOTES
FORTHCOMING ISSUES
| ISSUE | Release Date |
| February 2008 | 7 April 2008 |
| March 2008 | 1 May 2008 |
| April 2008 | 3 June 2008 |
| May 2008 | 2 July 2008 |
| June 2008 | 30 July 2008 |
| July 2008 | 2 September 2008 |
CHANGES IN THIS ISSUE
Commencing with the February 2008 issue, of this publication, the Time Series Spreadsheet tables 83 to 91 will no longer be available on the ABS web site. A concordance between the 1986 FCB and the 1999 FCB is available in the classification manual -
ABS Functional Classification of Buildings, 1999 (cat. no. 1268.0.55.001).
REVISIONS THIS MONTH
Revisions to the total number of dwelling units approved in this issue are:
 | 2006-07 | 2007-08 | TOTAL |
|
| NSW | 21 | 124 | 145 |
| Vic. | - | 538 | 538 |
| Qld | - | 66 | 66 |
| SA | - | 55 | 55 |
| WA | - | 114 | 114 |
| Tas. | 3 | 2 | 5 |
| NT | - | - | - |
| ACT | - | - | - |
| Total | 24 | 899 | 923 |
|
Late receipt of data from the Victorian Building Commission resulted in an upward revision of 537 dwelling units to the estimate for Victoria in December 2007.
One missing permit, added to November 2007 data, contributed an upward revision of $40.1m to the estimate of the value of non-residential approvals in the Australian Capital Territory.
Revisions to the value of two non-residential building approvals removed $309m from the estimate for New South Wales in November 2007.
DATA NOTES
There are no notes about the data.
INQUIRIES
For further information about these and related statistics, contact the National Information and Referral Service on 1300 135 070 or Paul Pamment on Adelaide (08) 8237 7648.
 Print Page
 Print All
 Quality Declaration