(a) Seasonally adjusted numbers of new motor vehicle sales in Tasmania, Northern Territory and Australian Capital Territory should be used with caution. For more information, see paragraph 7 of the Explanatory Notes.
MARCH KEY POINTS
TOTAL NEW MOTOR VEHICLE SALES
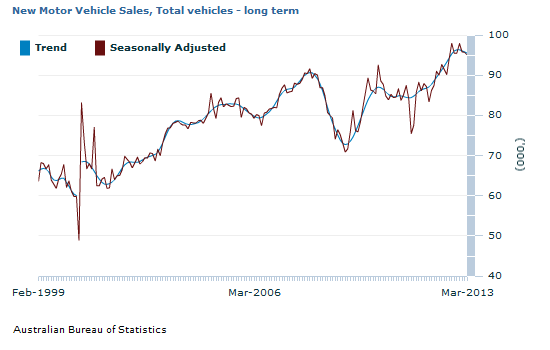
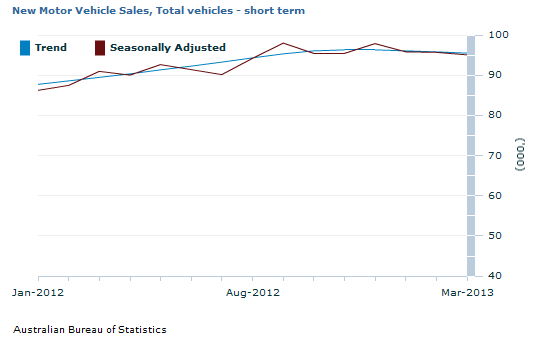
Trend estimates: The March 2013 trend estimate (95 497) has decreased by 0.4% when compared with February 2013.
Seasonally adjusted estimates: The March 2013 seasonally adjusted estimate (95 113) has decreased by 0.6% when compared with February 2013.
SALES BY TYPE OF VEHICLE
Trend estimates: When comparing national trend estimates for March 2013 with February 2013, sales of Sports utility vehicles increased by 1.1%. Over the same period, Passenger vehicles and Other vehicles sales decreased by 1.3% and 0.2% respectively.
Seasonally adjusted estimates: When comparing seasonally adjusted estimates for March 2013 with February 2013, sales of Passenger vehicles increased by 3.3%. Over the same period, Sports utility vehicles and Other vehicles sales decreased by 0.5% and 9.1% respectively.
SALES BY STATE
Trend estimates: Seven of the eight states and territories experienced a decrease in new motor vehicle sales when comparing March 2013 with February 2013. Victoria recorded the largest percentage decrease (0.7%), followed by Western Australia (0.6%) and then the Northern Territory (0.5%). Over the same period, the Australian Capital Territory remained unchanged.
Seasonally adjusted estimates: Four of the eight states and territories experienced an increase in new motor vehicle sales when comparing March 2013 with February 2013. Tasmania recorded the largest percentage increase (7.7%), followed by the Australian Capital Territory (2.8%) and Queensland (1.9%). Over the same period, Victoria and Western Australia decreased by 3.1% and 2.2% respectively.
NOTES
FORTHCOMING ISSUES
ISSUE
Release Date
April 2013
15 May 2013
May 2013
17 June 2013
June 2013
15 July 2013
July 2013
19 August 2013
Sales of New Motor Vehicles For August 2013
17 September 2013
New Motor Vehicle Sales September 2013
15 October 2013
ABOUT THIS ISSUE
This issue presents details for the Sales of New Motor Vehicles for March 2013.
DATA NOTES
The flooding which occurred in Thailand in June 2011 may have had an impact on new vehicle sales in Australia due to associated delays in delivery of Thai manufactured vehicles and vehicle parts. The impacts from the flooding is no longer affecting the supply of new motor vehicles to Australia from Thailand.
INQUIRIES
For further information about these and related statistics, contact the National Information and Referral Service on 1300 135 070.
SUMMARY COMMENTARY
Footnote(s): Break in time series for trend between June and July 2000. See paragraph 13 of the Expanatory Notes.
New motor vehicle sales by type of vehicle by month
Passenger vehicles
Sports utility vehicles
Other vehicles
Total vehicles
Change Passenger vehicles
Change Sports utility vehicles
Change Other vehicles
Change Total vehicles
no.
no.
no.
no.
%
%
%
%
Trend
2012
January
46 912
23 585
17 226
87 723
0.3
2.1
-0.1
0.7
February
47 161
24 060
17 364
88 585
0.5
2.0
0.8
1.0
March
47 313
24 477
17 690
89 480
0.3
1.7
1.9
1.0
April
47 312
24 869
18 193
90 374
-
1.6
2.8
1.0
May
47 222
25 306
18 795
91 323
-0.2
1.8
3.3
1.1
June
47 163
25 720
19 388
92 270
-0.1
1.6
3.2
1.0
July
47 402
26 009
19 867
93 278
0.5
1.1
2.5
1.1
August
47 984
26 179
20 184
94 347
1.2
0.7
1.6
1.1
September
48 657
26 274
20 409
95 341
1.4
0.4
1.1
1.1
October
49 138
26 372
20 547
96 056
1.0
0.4
0.7
0.8
November
49 230
26 516
20 609
96 356
0.2
0.5
0.3
0.3
December
48 912
26 755
20 637
96 304
-0.6
0.9
0.1
-0.1
2013
January
48 354
27 076
20 665
96 094
-1.1
1.2
0.1
-0.2
February
47 757
27 413
20 666
95 836
-1.2
1.2
-
-0.3
March
47 142
27 728
20 627
95 497
-1.3
1.1
-0.2
-0.4
Seasonally Adjusted
2012
January
47 339
23 564
15 371
86 274
4.1
2.9
2.9
3.6
February
47 057
23 486
16 953
87 496
-0.6
-0.3
10.3
1.4
March
47 823
25 255
17 907
90 985
1.6
7.5
5.6
4.0
April
46 748
24 776
18 492
90 016
-2.2
-1.9
3.3
-1.1
May
48 453
25 348
18 868
92 668
3.6
2.3
2.0
2.9
June
47 195
25 688
18 543
91 426
-2.6
1.3
-1.7
-1.3
July
44 481
25 259
20 430
90 170
-5.8
-1.7
10.2
-1.4
August
47 068
26 611
20 519
94 198
5.8
5.4
0.4
4.5
September
49 865
27 436
20 680
97 981
5.9
3.1
0.8
4.0
October
48 935
26 325
20 223
95 484
-1.9
-4.0
-2.2
-2.5
November
50 219
24 934
20 299
95 452
2.6
-5.3
0.4
-
December
50 629
26 819
20 452
97 900
0.8
7.6
0.8
2.6
2013
January
46 798
27 841
21 162
95 801
-7.6
3.8
3.5
-2.1
February
46 189
27 930
21 598
95 716
-1.3
0.3
2.1
-0.1
March
47 698
27 790
19 625
95 113
3.3
-0.5
-9.1
-0.6
Original
2012
January
42 555
22 123
12 105
76 783
-7.0
-1.1
-15.5
-6.9
February
46 019
23 448
16 256
85 723
8.1
6.0
34.3
11.6
March
51 161
27 363
19 092
97 616
11.2
16.7
17.4
13.9
April
40 496
21 841
16 760
79 097
-20.8
-20.2
-12.2
-19.0
May
48 448
26 863
20 758
96 069
19.6
23.0
23.9
21.5
June
57 439
31 617
23 510
112 566
18.6
17.7
13.3
17.2
July
43 354
23 845
19 442
86 641
-24.5
-24.6
-17.3
-23.0
August
46 612
26 216
20 724
93 552
7.5
9.9
6.6
8.0
September
49 210
25 079
20 338
94 627
5.6
-4.3
-1.9
1.1
October
49 291
25 737
20 556
95 584
0.2
2.6
1.1
1.0
November
51 652
26 145
20 550
98 347
4.8
1.6
-
2.9
December
50 618
25 548
19 261
95 427
-2.0
-2.3
-6.3
-3.0
2013
January
41 957
26 623
16 850
85 430
-17.1
4.2
-12.5
-10.5
February
43 338
26 834
20 046
90 218
3.3
0.8
19.0
5.6
March
48 664
29 148
19 588
97 400
12.3
8.6
-2.3
8.0
- nil or rounded to zero (including null cells)
New motor vehicle sales by state/territory of registration
NSW
Vic.
Qld
SA
WA
Tas.(a)
NT(a)
ACT(a)
Aust.
no.
no.
no.
no.
no.
no.
no.
no.
no.
Trend
2012
January
27 196
23 209
18 620
5 387
9 802
1 275
881
1 353
87 723
February
27 358
23 502
18 724
5 459
10 012
1 276
895
1 361
88 585
March
27 555
23 728
18 885
5 520
10 209
1 286
919
1 377
89 480
April
27 807
23 891
19 106
5 560
10 360
1 302
946
1 402
90 374
May
28 121
24 053
19 370
5 588
10 476
1 320
967
1 429
91 323
June
28 416
24 251
19 625
5 616
10 580
1 348
981
1 453
92 270
July
28 665
24 522
19 876
5 656
10 704
1 393
990
1 472
93 278
August
28 897
24 847
20 105
5 717
10 854
1 445
993
1 488
94 347
September
29 101
25 170
20 277
5 801
11 012
1 492
987
1 499
95 341
October
29 244
25 388
20 366
5 883
11 159
1 524
980
1 511
96 056
November
29 290
25 433
20 389
5 941
11 262
1 542
976
1 522
96 356
December
29 249
25 354
20 367
5 983
11 296
1 549
973
1 532
96 304
2013
January
29 168
25 232
20 342
6 011
11 285
1 554
966
1 536
96 094
February
29 072
25 099
20 325
6 026
11 255
1 563
961
1 536
95 836
March
29 001
24 931
20 299
6 024
11 189
1 561
956
1 536
95 497
Seasonally Adjusted
2012
January
26 578
22 728
18 489
5 052
9 870
1 185
968
1 404
86 274
February
26 777
23 291
18 783
5 400
9 810
1 323
853
1 260
87 496
March
27 903
24 502
18 908
5 877
10 178
1 343
912
1 363
90 985
April
27 770
24 010
18 885
5 523
10 287
1 316
851
1 375
90 016
May
28 686
23 917
19 857
5 465
10 912
1 314
1 072
1 445
92 668
June
28 430
23 961
19 094
5 577
10 401
1 351
1 053
1 559
91 426
July
27 506
23 944
18 752
5 616
10 597
1 444
929
1 382
90 170
August
29 378
24 754
20 084
5 719
10 552
1 278
946
1 487
94 198
September
29 753
26 341
20 587
5 940
11 269
1 578
984
1 530
97 981
October
29 109
25 225
20 056
5 854
11 207
1 540
1 023
1 469
95 484
November
28 666
25 034
20 445
5 815
11 268
1 683
1 002
1 538
95 452
December
30 001
25 546
20 782
6 075
11 496
1 466
966
1 566
97 900
2013
January
28 969
25 219
20 020
6 378
11 125
1 657
899
1 534
95 801
February
28 958
25 358
20 117
5 948
11 308
1 537
987
1 504
95 716
March
28 960
24 576
20 501
5 844
11 056
1 655
975
1 545
95 113
Original
2012
January
24 004
20 278
15 732
4 622
9 014
1 008
820
1 305
76 783
February
26 391
23 270
17 839
5 344
9 673
1 148
776
1 282
85 723
March
30 209
26 177
20 718
6 037
10 644
1 361
1 052
1 418
97 616
April
24 426
20 785
17 062
4 746
8 939
1 072
863
1 204
79 097
May
29 811
24 600
20 933
5 689
11 025
1 266
1 252
1 493
96 069
June
34 785
28 662
25 051
6 728
12 698
1 443
1 357
1 842
112 566
July
26 594
22 991
18 234
5 298
9 968
1 268
917
1 371
86 641
August
28 706
24 696
19 791
5 577
11 072
1 365
898
1 447
93 552
September
28 854
25 263
19 579
5 821
11 054
1 651
918
1 487
94 627
October
28 792
26 078
19 602
5 848
11 228
1 612
949
1 475
95 584
November
30 030
25 740
20 368
6 024
11 676
2 015
938
1 556
98 347
December
28 619
25 238
20 116
6 265
11 014
1 772
859
1 544
95 427
2013
January
26 194
22 583
16 946
5 918
10 198
1 403
748
1 440
85 430
February
27 427
24 415
18 369
5 696
10 679
1 309
867
1 456
90 218
March
29 928
25 360
21 135
5 680
11 145
1 564
1 075
1 513
97 400
(a) Seasonally adjusted numbers of new motor vehicle sales in Tasmania, Northern Territory and Australian Capital Territory should be used with caution. For more information, see paragraph 7 of the Explanatory Notes.
Document Selection
These documents will be presented in a new window.
 Quality Declaration
  Print Page
 Print All