OCTOBER KEY FIGURES
 | August 2005 | September 2005 | October 2005 | Sep 05 to Oct 05 |  |
 | $m | $m | $m | % change |  |
Trend |  |
|  |
| Balance on goods & services | -1 344 | -1 359 | -1 419 | . . |  |
| Credits (exports of goods & services) | 14 955 | 14 954 | 14 915 | - |  |
| Debits (imports of goods & services) | 16 299 | 16 313 | 16 334 | - |  |
Seasonally Adjusted |  |
|  |
| Balance on goods & services | -1 411 | -1 564 | -1 332 | . . |  |
| Credits (exports of goods & services) | 14 824 | 14 702 | 15 033 | 2 |  |
| Debits (imports of goods & services) | 16 235 | 16 266 | 16 365 | 1 |  |
|  |
| . . not applicable |
| - nil or rounded to zero (including null cells) |
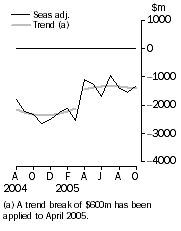
Balance on goods and services
|  |
OCTOBER KEY POINTS
TREND ESTIMATES
- The provisional trend estimate of the balance on goods and services was a deficit of $1,419m in October 2005, an increase of $60m on the revised deficit in September.
- Goods and services credits fell $39m to $14,915m. Goods and services debits rose $21m to $16,334m.
SEASONALLY ADJUSTED ESTIMATES
- In seasonally adjusted terms, the balance on goods and services was a deficit of $1,332m in October, a decrease of $232m on the revised deficit in September.
- Goods and services credits rose $331m (2%) to $15,033m. Non-rural and other goods rose $333m (3%), and rural goods rose $20m (1%). Services credits fell $22m (1%).
- Goods and services debits rose $99m (1%) to $16,365m. Capital goods rose $197m (7%), while consumption goods fell $98m (2%) and intermediate and other goods fell $11m. Services debits rose $11m.
ORIGINAL ESTIMATES
- In original terms, the October balance on goods and services was a deficit of $1,138m, a decrease of $1,374m on the deficit in September. Goods and services credits rose $1,014m (7%) while goods and services debits fell $360m (2%).
- In the four months to October, exports of non-rural and other goods were up $7.8b (24%) while rural goods were down $0.9b (10%) on the corresponding period in 2004-05.
NOTES
CHANGES TO THIS ISSUE
Seasonal adjustment
Commencing with this issue, the monthly goods series are seasonally adjusted at a more detailed level consistent with the quarterly series presented in Balance of Payments and International Investment Position, Australia (cat. no. 5302.0), except that other non-rural credits will not be split between beverages, sugar and other. This will ensure greater consistency between the monthly and quarterly seasonally adjusted goods series.
To coincide with the introduction of more detailed seasonal adjustment, a seasonal reanalysis of all monthly series was undertaken. The detailed seasonal analysis has identified five monthly series that do not display seasonal patterns: in goods credits, the repairs on goods series; in goods debits, the civil aircraft, fuels and lubricants, goods for processing and goods procured in ports by carriers series. The introduction of this more detailed seasonal adjustment has resulted in revisions to the seasonally adjusted and trend series.
The change to detailed monthly seasonal adjustment has resulted in: additional tables; consequential table renumbering; some reformatting of table presentations; and corresponding changes to AusStats table presentations. Details of these changes were released on the ABS web site on 24 November 2005 as an information paper 5368.0.55.002.
Detailed Services data
Two additional data cubes are released on AusStats concurrently with this publication:
- Table 67 - Trade in services, debits and credits, financial year by detailed service
- Table 68 - Trade in services, debits and credits, calendar year by detailed service
These tables provide disaggregated services data which has been in demand from a number of ABS clients.
In addition, AusStats tables 59 to 67 (services debits and credits by country) have been updated to correct inconsistencies in the derivation of the EU for 2004 and 2004-05.
INQUIRIES
For further information about these and related statistics, contact the National Information and Referral Service on 1300 135 070 or Tom Jebbink on Canberra (02) 6252 5540.
FEATURE ARTICLES
AUSTRALIA'S EXPORTERS
A feature article on Australia's Exporters, 2004-05 will be released on the ABS web site on Friday, 9 December 2005. The article is the sixth in a series analysing the characteristics and international trading activities of Australia's exporters, based on the Australian Business Number (ABN).
To access this article on the web site select: Themes then International Trade then Topics of Interest.
CUSTOMS AND ABS CHANGES TO IMPORTS FROM OCTOBER 2005
As foreshadowed in the September 2005 issue of this publication, the Australian Customs Service implemented the imports component of the Integrated Cargo System (ICS) during October 2005.
The ABS has worked closely with Customs to ensure that the new system did not have a detrimental effect on merchandise trade statistics. The ABS is confident that the information coming from the ICS is of sufficient quality to prepare the estimates contained in this publication.
The value of goods debits for October is largely consistent with the value of the preceding months and previous Octobers. For merchandise trade statistical purposes, goods are considered imported into Australia when the Customs documentation is finalised. Therefore, any delays to the clearance of goods from ports will not necessarily impact on ABS merchandise import statistics.
While the timing of Customs documentation being finalised is considered a good proxy for when goods change ownership, adjustments for timing and coverage can be applied in the compilation of the Balance of Payments. A significant delay to the finalisation of Customs documentation may necessitate a timing adjustment. It has not been necessary to apply a timing adjustment to October imports (on a Balance of Payments basis) as a result of the introduction of Customs ICS.
For more information on these changes refer to the article Impact of Customs and ABS changes on import statistics from October 2005, released on the ABS web site on 30 November 2005.
To access this article on the web site select: Themes then International Trade then Topics of Interest then Methodological issues.
ANALYSIS AND COMMENTS
BALANCE ON GOODS AND SERVICES
The trend estimate of the balance on goods and services in October 2005 was a deficit of $1,419m, an increase of $60m on the deficit in September.
In seasonally adjusted terms, the balance on goods and services in October 2005 was a deficit of $1,332m, a decrease of $232m on the deficit in September.
EXPORTS OF GOODS AND SERVICES
The trend estimate of goods and services credits fell $39m between September and October to $14,915m.
In seasonally adjusted terms, goods and services credits rose $331m (2%) to $15,033m. Non-rural and other goods rose $333m (3%), rural goods rose $20m (1%) while services credits fell $22m (1%).
Exports of goods
GOODS CREDITS
Rural goods
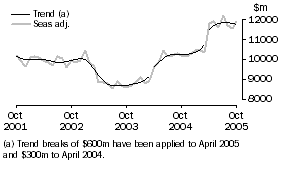
The trend estimate of rural goods exports fell $14m (1%) to $2,032m.
In seasonally adjusted terms, exports of rural goods rose $20m (1%) to $2,050m.
Cereal grains and cereal preparations, up $38m (11%), was the main contributor to the rise in the seasonally adjusted series but was partly offset by other rural, down $19m (2%).
In original terms, exports of rural goods rose $85m (4%) to $2,137m.
Non-rural and other goods
The trend estimate of non-rural and other goods exports fell $36m to $9,743m.
In seasonally adjusted terms, exports of non-rural and other goods rose $333m (3%) to $9,865m.
The main movements in the seasonally adjusted components contributing to this rise were:
- other mineral fuels, up $126m (14%)
- other manufactures, up $89m (8%)
- metal ores and minerals, up $81m (4%)
- non-monetary gold, up $55m (13%)
- coal, coke and briquettes, up $34m (2%).
Partly offsetting these effects were:
- transport equipment, down $29m (6%)
- other non-rural, down $28m (3%).
In original terms, exports of non-rural and other goods rose $724m (7%) to $10,487m.
Exports of services
SERVICES CREDITS
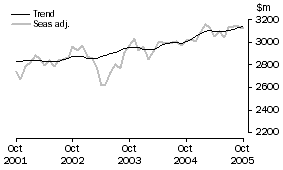
In trend terms, services credits rose $11m to $3,140m.
Seasonally adjusted, services credits fell $22m (1%) to $3,118m.
Travel services, down $26m (2%), was the main contributor to the fall in the seasonally adjusted series.
Seasonally adjusted, tourism related services credits fell $18m (1%) to $2,005m.
IMPORTS OF GOODS AND SERVICES
The trend estimate of goods and services debits rose $21m between September and October to $16,334m.
In seasonally adjusted terms, goods and services debits rose $99m (1%) to $16,365m. Capital goods rose $197m (7%), services rose $11m, while consumption goods fell $98m (2%) and intermediate and other goods fell $11m.
Imports of goods
GOODS DEBITS
Consumption goods
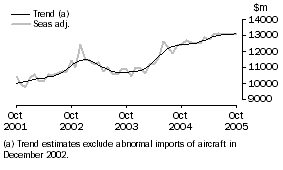
The trend estimate of imports of consumption goods fell $12m to $3,979m.
In seasonally adjusted terms, imports of consumption goods fell $98m (2%) to $3,889m.
The main movements in the seasonally adjusted components contributing to this fall were:
- food and beverages, down $43m (8%)
- toys, books and leisure goods, down $34m (10%)
- household electrical items, down $30m (9%).
In original terms, imports of consumption goods fell $307m (7%) to $4,235m.
Capital goods
The trend estimate of imports of capital goods rose $12m to $3,043m.
In seasonally adjusted terms, imports of capital goods rose $197m (7%) to $3,184m.
The main components contributing to the rise in the seasonally adjusted estimates were:
- civil aircraft, up $227m
- industrial transport equipment n.e.s., up $64m (15%).
Partly offsetting these effects were:
- telecommunications equipment, down $43m (10%)
- machinery and industrial equipment, down $33m (3%)
- ADP equipment, down $29m (6%).
In original terms, imports of capital goods rose $205m (7%) to $3,274m.
Intermediate and Other Goods
The trend estimate of imports of intermediate and other goods rose $22m to $6,105m.
In seasonally adjusted terms, intermediate and other goods imports fell $11m to $6,079m.
The main movements contributing to the fall in the seasonally adjusted estimates were:
- goods for processing, down $124m (47%)
- processed industrial supplies n.e.s., down $59m (5%)
- non-monetary gold, down $40m (37%)
- parts for transport equipment, down $30m (5%).
Partly offsetting these effects were:
- fuels and lubricants, up $190m (13%)
- other merchandise goods, up $79m (89%).
In original terms, intermediate and other goods imports fell $147m (2%) to $6,099m.
Processed industrial supplies n.e.s., down $128m (10%) and other goods, down $155m (33%) were the main contributors to this fall. However, fuels and lubricants increased by $190m (13%) with volumes of crude petroleum up by 40%.
Imports of services
SERVICES DEBITS
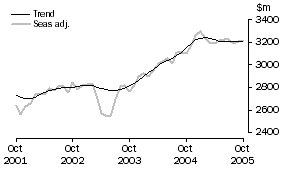
In trend terms, services debits fell $1m to $3,207m.
Seasonally adjusted, services debits rose $11m to $3,213m.
The movements in the seasonally adjusted components contributing to this rise were:
- travel services, up $18m (1%)
- transportation services, up $17m (2%).
Partly offsetting these effects were other services, down $24m (3%).
Seasonally adjusted, tourism related services debits fell $2m to $1,702m.
 Print Page
 Print All