(a) Seasonally adjusted numbers of new motor vehicle sales in Tasmania, Northern Territory and Australian Capital Territory should be used with caution. For more information, see paragraph 7 of the Explanatory Notes.
JANUARY TREND ESTIMATES KEY POINTS
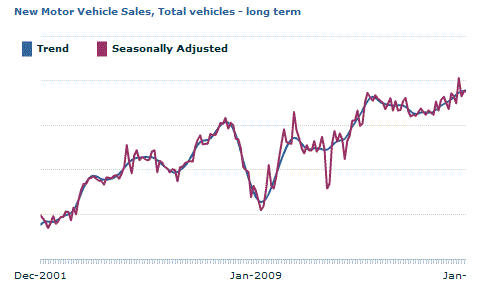
The January 2016 trend estimate (97 973) has increased by 0.2% when compared with December 2015.
When comparing national trend estimates for January 2016 with December 2015, sales of Passenger vehicles decreased by 0.6% and Sports utility and Other vehicles increased by 0.2% and 1.6% respectively.
The largest upward movement across all states and territories, on a trend basis, was in South Australia (1.5%) which has been trending upwards since August 2015.
The only jurisdiction to record a downward movement in trend data was the Australian Capital Territory (1.6%), continuing a downward trend which commenced in October 2015.
New motor vehicle sales by type of vehicle by month
Passenger vehicles
Sports utility vehicles
Other vehicles
Total vehicles
Change Passenger vehicles
Change Sports utility vehicles
Change Other vehicles
Change Total vehicles
no.
no.
no.
no.
%
%
%
%
Trend
2014
November
43 196
30 468
19 383
93 047
-0.2
1.0
0.2
0.3
December
43 130
30 911
19 424
93 465
-0.2
1.5
0.2
0.4
2015
January
43 071
31 430
19 429
93 931
-0.1
1.7
-
0.5
February
43 037
31 961
19 410
94 409
-0.1
1.7
-0.1
0.5
March
42 960
32 417
19 396
94 773
-0.2
1.4
-0.1
0.4
April
42 911
32 834
19 345
95 089
-0.1
1.3
-0.3
0.3
May
42 911
33 286
19 218
95 416
-
1.4
-0.7
0.3
June
42 896
33 854
19 083
95 832
-
1.7
-0.7
0.4
July
42 895
34 471
18 978
96 344
-
1.8
-0.6
0.5
August
42 840
35 072
18 953
96 865
-0.1
1.7
-0.1
0.5
September
42 625
35 582
19 090
97 297
-0.5
1.5
0.7
0.4
October
42 267
35 936
19 360
97 563
-0.8
1.0
1.4
0.3
November
41 891
36 143
19 697
97 731
-0.9
0.6
1.7
0.2
December
41 518
36 267
20 039
97 824
-0.9
0.3
1.7
0.1
2016
January
41 274
36 341
20 358
97 973
-0.6
0.2
1.6
0.2
Seasonally Adjusted
2014
November
43 026
30 642
18 648
92 317
-1.5
2.5
-3.1
-0.6
December
43 649
31 049
20 598
95 296
1.4
1.3
10.5
3.2
2015
January
44 129
30 107
19 034
93 270
1.1
-3.0
-7.6
-2.1
February
43 250
33 252
19 127
95 630
-2.0
10.4
0.5
2.5
March
45 132
31 764
19 485
96 382
4.4
-4.5
1.9
0.8
April
41 183
34 421
19 421
95 025
-8.8
8.4
-0.3
-1.4
May
42 260
32 160
19 225
93 646
2.6
-6.6
-1.0
-1.5
June
44 567
33 388
19 216
97 172
5.5
3.8
-
3.8
July
42 793
34 356
19 347
96 497
-4.0
2.9
0.7
-0.7
August
41 615
34 777
18 556
94 949
-2.8
1.2
-4.1
-1.6
September
44 557
37 535
18 480
100 572
7.1
7.9
-0.4
5.9
October
41 075
36 220
19 203
96 498
-7.8
-3.5
3.9
-4.1
November
41 526
35 559
20 609
97 693
1.1
-1.8
7.3
1.2
December
42 924
35 165
19 491
97 580
3.4
-1.1
-5.4
-0.1
2016
January
40 086
37 116
20 853
98 055
-6.6
5.5
7.0
0.5
Original
2014
November
43 063
31 032
18 137
92 232
-0.1
7.6
-5.9
1.1
December
45 051
30 666
21 092
96 809
4.6
-1.2
16.3
5.0
2015
January
39 799
27 679
14 638
82 116
-11.7
-9.7
-30.6
-15.2
February
40 775
32 039
17 610
90 424
2.5
15.8
20.3
10.1
March
48 185
35 503
21 366
105 054
18.2
10.8
21.3
16.2
April
35 015
29 664
16 977
81 656
-27.3
-16.4
-20.5
-22.3
May
40 592
32 530
20 205
93 327
15.9
9.7
19.0
14.3
June
56 386
42 256
27 208
125 850
38.9
29.9
34.7
34.8
July
41 420
32 679
18 209
92 308
-26.5
-22.7
-33.1
-26.7
August
40 673
32 900
17 132
90 705
-1.8
0.7
-5.9
-1.7
September
46 084
36 968
18 340
101 392
13.3
12.4
7.1
11.8
October
40 856
34 744
18 721
94 321
-11.3
-6.0
2.1
-7.0
November
41 726
36 070
20 843
98 639
2.1
3.8
11.3
4.6
December
44 172
35 439
20 005
99 616
5.9
-1.7
-4.0
1.0
2016
January
35 214
33 073
16 086
84 373
-20.3
-6.7
-19.6
-15.3
- nil or rounded to zero (including null cells)
New motor vehicle sales by state/territory of registration
NSW
Vic.
Qld
SA
WA
Tas.(a)
NT(a)
ACT(a)
Aust.
no.
no.
no.
no.
no.
no.
no.
no.
no.
Trend
2014
November
30 238
25 586
18 413
5 750
9 252
1 469
913
1 425
93 047
December
30 317
25 736
18 641
5 750
9 152
1 512
923
1 434
93 465
2015
January
30 398
25 854
18 901
5 770
9 071
1 551
936
1 449
93 931
February
30 542
25 932
19 150
5 793
9 001
1 581
944
1 465
94 409
March
30 740
25 959
19 328
5 795
8 933
1 598
946
1 474
94 773
April
31 023
25 988
19 430
5 753
8 876
1 602
937
1 480
95 089
May
31 384
26 060
19 462
5 683
8 822
1 598
918
1 488
95 416
June
31 768
26 172
19 509
5 613
8 780
1 594
892
1 504
95 832
July
32 122
26 308
19 593
5 575
8 761
1 595
864
1 525
96 344
August
32 371
26 450
19 691
5 602
8 765
1 602
840
1 543
96 865
September
32 507
26 583
19 767
5 679
8 779
1 607
827
1 548
97 297
October
32 548
26 679
19 807
5 779
8 787
1 609
819
1 535
97 563
November
32 560
26 727
19 826
5 886
8 794
1 610
815
1 513
97 731
December
32 556
26 746
19 825
5 986
8 802
1 609
813
1 487
97 824
2016
January
32 581
26 749
19 855
6 076
8 824
1 612
813
1 463
97 973
Seasonally Adjusted
2014
November
29 864
25 784
17 960
5 797
9 133
1 446
907
1 425
92 317
December
30 607
26 001
20 330
5 529
9 047
1 418
970
1 395
95 296
2015
January
30 092
25 650
18 954
5 676
8 972
1 632
847
1 447
93 270
February
30 704
25 738
19 723
6 133
9 177
1 654
1 006
1 495
95 630
March
30 982
26 129
20 400
5 747
9 078
1 575
930
1 541
96 382
April
30 443
26 554
19 461
5 757
8 817
1 595
952
1 446
95 025
May
31 234
25 324
18 965
5 625
8 596
1 530
940
1 433
93 646
June
32 427
26 095
20 018
5 668
8 914
1 647
887
1 516
97 172
July
31 910
26 742
19 460
5 651
8 751
1 610
848
1 526
96 497
August
31 820
25 792
19 300
5 276
8 720
1 704
829
1 507
94 949
September
33 673
27 546
20 283
5 770
8 917
1 939
808
1 636
100 572
October
32 222
26 224
19 477
5 868
8 682
1 620
849
1 557
96 498
November
32 203
26 620
20 406
5 832
8 785
1 547
798
1 502
97 693
December
32 652
26 957
19 216
6 038
8 800
1 668
818
1 431
97 580
2016
January
32 560
26 642
20 005
6 115
8 874
1 587
817
1 455
98 055
Original
2014
November
30 419
26 282
16 814
5 888
8 876
1 650
841
1 462
92 232
December
30 257
26 783
20 853
5 830
9 143
1 645
894
1 404
96 809
2015
January
26 796
22 211
16 570
5 039
8 101
1 364
662
1 373
82 116
February
28 975
24 742
18 212
5 915
8 851
1 409
877
1 443
90 424
March
33 773
28 536
22 499
6 173
9 823
1 560
1 064
1 626
105 054
April
26 264
22 160
17 335
4 843
7 609
1 280
948
1 217
81 656
May
30 996
25 231
19 312
5 429
8 353
1 440
1 144
1 422
93 327
June
42 105
32 615
27 270
7 286
11 503
1 989
1 189
1 893
125 850
July
30 332
25 902
18 700
5 256
8 341
1 445
836
1 496
92 308
August
30 529
24 608
18 183
5 088
8 371
1 710
767
1 449
90 705
September
33 983
27 675
20 387
5 859
9 009
2 090
785
1 604
101 392
October
31 196
26 503
18 246
5 825
8 534
1 719
785
1 513
94 321
November
33 176
27 421
19 249
6 019
8 724
1 764
734
1 552
98 639
December
32 740
27 785
19 711
6 315
8 969
1 913
733
1 450
99 616
2016
January
28 392
22 426
17 193
5 208
7 861
1 298
626
1 369
84 373
(a) Seasonally adjusted numbers of new motor vehicle sales in Tasmania, Northern Territory and Australian Capital Territory should be used with caution. For more information, see paragraph 7 of the Explanatory Notes.
NOTES
FORTHCOMING ISSUES
ISSUE
Release Date
February 2016
15 March 2016
March 2016
18 April 2016
April 2016
17 May 2016
May 2016
16 June 2016
June 2016
14 July 2016
July 2016
16 August 2016
ABOUT THIS ISSUE
This issue presents details for the Sales of New Motor Vehicles for January 2016.
INQUIRIES
For further information about these and related statistics, contact the National Information and Referral Service on 1300 135 070. The ABS Privacy Policy outlines how the ABS will handle any personal information that you provide to us.
Document Selection
These documents will be presented in a new window.
 Quality Declaration
  Print Page
 Print All