(a) Seasonally adjusted numbers of new motor vehicle sales in Tasmania, Northern Territory and Australian Capital Territory should be used with caution. For more information, see paragraph 7 of the Explanatory Notes.
OCTOBER KEY POINTS
TOTAL NEW MOTOR VEHICLE SALES
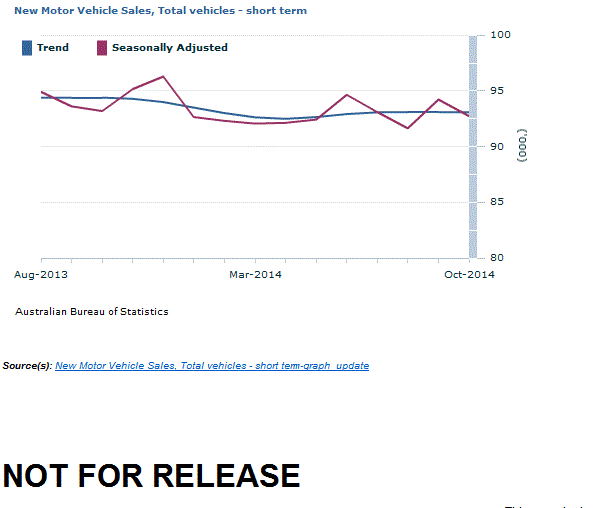
Trend estimates: The October 2014 trend estimate (93 080) has decreased by 25 units when compared with September 2014.
Seasonally adjusted estimates: The October 2014 seasonally adjusted estimate (92 741) has decreased by 1.6% when compared with September 2014.
SALES BY TYPE OF VEHICLE
Trend estimates: When comparing national trend estimates for October 2014 with September 2014, sales of Passenger and Other vehicles decreased by 0.4% and 0.2% respectively. Over the same period, Sports utility vehicles increased by 0.6%.
Seasonally adjusted estimates: When comparing seasonally adjusted estimates for October 2014 with September 2014, sales of Passenger, Sports utility and Other vehicles decreased by 1.0%, 3.0% and 0.6% respectively.
SALES BY STATE
Trend estimates: Seven of the eight states and territories experienced a decrease in new motor vehicle sales when comparing October 2014 with September 2014. The Northern Territory recorded the largest percentage decrease (1.2%), followed by Western Australia (0.8%) and Queensland (0.4%). Over the same period, New South Wales recorded an increase in sales of 0.5%.
Seasonally adjusted estimates: Six of the states and territories experienced a decrease in new motor vehicle sales when comparing October 2014 with September 2014. Tasmania recorded the largest percentage decrease (10.9%) followed by both Queensland and the Australian Capital Territory (4.7%). Over the same period, the Northern Territory recorded the largest increase in sales (1.0%).
SUMMARY COMMENTARY
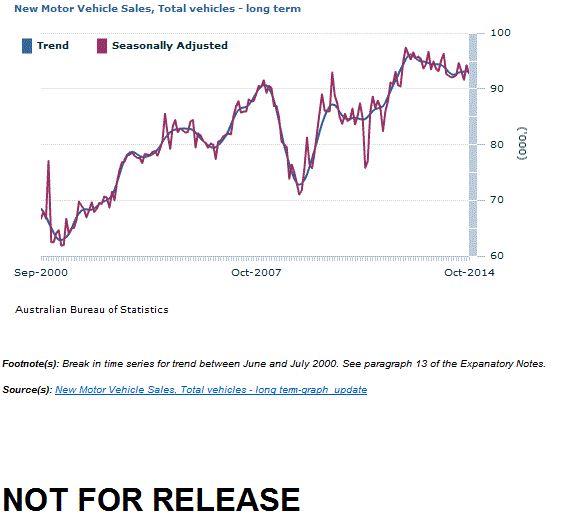
Footnote(s): Break in time series for trend between June and July 2000. See paragraph 13 of the Expanatory Notes.
New motor vehicle sales by type of vehicle by month
Passenger vehicles
Sports utility vehicles
Other vehicles
Total vehicles
Change Passenger vehicles
Change Sports utility vehicles
Change Other vehicles
Change Total vehicles
no.
no.
no.
no.
%
%
%
%
Trend
2013
August
47 541
27 705
19 132
94 378
-0.2
0.3
-0.3
-0.1
September
47 450
27 790
19 149
94 390
-0.2
0.3
0.1
-
October
47 335
27 856
19 193
94 384
-0.2
0.2
0.2
-
November
47 124
27 905
19 247
94 277
-0.4
0.2
0.3
-0.1
December
46 792
27 956
19 232
93 980
-0.7
0.2
-0.1
-0.3
2014
January
46 330
28 031
19 144
93 505
-1.0
0.3
-0.5
-0.5
February
45 805
28 185
19 010
93 000
-1.1
0.5
-0.7
-0.5
March
45 314
28 408
18 910
92 633
-1.1
0.8
-0.5
-0.4
April
44 905
28 689
18 903
92 496
-0.9
1.0
-
-0.1
May
44 620
29 041
18 978
92 638
-0.6
1.2
0.4
0.2
June
44 422
29 409
19 083
92 913
-0.4
1.3
0.6
0.3
July
44 242
29 701
19 123
93 066
-0.4
1.0
0.2
0.2
August
44 057
29 945
19 102
93 103
-0.4
0.8
-0.1
-
September
43 884
30 153
19 068
93 105
-0.4
0.7
-0.2
-
October
43 703
30 342
19 035
93 080
-0.4
0.6
-0.2
-
Seasonally Adjusted
2013
August
47 971
28 469
18 460
94 899
2.3
4.9
-5.0
1.5
September
47 149
27 583
18 885
93 618
-1.7
-3.1
2.3
-1.4
October
47 222
27 034
18 934
93 191
0.2
-2.0
0.3
-0.5
November
47 386
28 446
19 335
95 167
0.3
5.2
2.1
2.1
December
47 122
28 789
20 375
96 286
-0.6
1.2
5.4
1.2
2014
January
46 023
27 708
18 921
92 652
-2.3
-3.8
-7.1
-3.8
February
46 236
27 336
18 748
92 320
0.5
-1.3
-0.9
-0.4
March
44 772
28 694
18 598
92 065
-3.2
5.0
-0.8
-0.3
April
45 102
28 666
18 372
92 140
0.7
-0.1
-1.2
0.1
May
44 033
29 282
19 108
92 423
-2.4
2.1
4.0
0.3
June
44 740
29 467
20 433
94 641
1.6
0.6
6.9
2.4
July
44 646
30 015
18 425
93 086
-0.2
1.9
-9.8
-1.6
August
43 738
29 137
18 760
91 635
-2.0
-2.9
1.8
-1.6
September
43 950
31 085
19 184
94 220
0.5
6.7
2.3
2.8
October
43 529
30 143
19 069
92 741
-1.0
-3.0
-0.6
-1.6
Original
2013
August
48 060
27 515
17 761
93 336
3.8
7.6
-3.2
3.4
September
47 149
26 199
19 314
92 662
-1.9
-4.8
8.7
-0.7
October
46 939
26 258
19 406
92 603
-0.4
0.2
0.5
-0.1
November
49 089
28 889
18 946
96 924
4.6
10.0
-2.4
4.7
December
47 686
28 543
20 527
96 756
-2.9
-1.2
8.3
-0.2
2014
January
41 626
25 868
14 791
82 285
-12.7
-9.4
-27.9
-15.0
February
43 651
25 867
17 300
86 818
4.9
-
17.0
5.5
March
47 079
30 778
19 410
97 267
7.9
19.0
12.2
12.0
April
39 027
25 350
16 333
80 710
-17.1
-17.6
-15.9
-17.0
May
43 819
30 730
20 013
94 562
12.3
21.2
22.5
17.2
June
53 844
36 846
27 619
118 309
22.9
19.9
38.0
25.1
July
43 464
28 805
17 598
89 867
-19.3
-21.8
-36.3
-24.0
August
42 658
27 543
17 956
88 157
-1.9
-4.4
2.0
-1.9
September
45 194
30 027
19 757
94 978
5.9
9.0
10.0
7.7
October
43 126
28 835
19 275
91 236
-4.6
-4.0
-2.4
-3.9
- nil or rounded to zero (including null cells)
New motor vehicle sales by state/territory of registration
NSW
Vic.
Qld
SA
WA
Tas.(a)
NT(a)
ACT(a)
Aust.
no.
no.
no.
no.
no.
no.
no.
no.
no.
Trend
2013
August
29 407
25 697
19 218
5 791
10 233
1 612
965
1 455
94 378
September
29 427
25 813
19 162
5 813
10 146
1 608
955
1 467
94 390
October
29 474
25 857
19 131
5 836
10 054
1 608
936
1 487
94 384
November
29 532
25 777
19 121
5 854
9 962
1 606
919
1 506
94 277
December
29 567
25 526
19 134
5 851
9 886
1 595
908
1 513
93 980
2014
January
29 550
25 188
19 114
5 837
9 837
1 574
907
1 499
93 505
February
29 476
24 907
19 032
5 824
9 830
1 543
915
1 473
93 000
March
29 396
24 798
18 889
5 818
9 852
1 510
925
1 445
92 633
April
29 346
24 882
18 715
5 826
9 883
1 485
932
1 428
92 496
May
29 408
25 099
18 570
5 843
9 892
1 466
933
1 428
92 638
June
29 585
25 311
18 477
5 858
9 865
1 451
927
1 439
92 913
July
29 790
25 402
18 404
5 865
9 799
1 439
916
1 452
93 066
August
29 983
25 412
18 332
5 867
9 716
1 430
905
1 458
93 103
September
30 169
25 386
18 269
5 864
9 635
1 425
897
1 459
93 105
October
30 325
25 363
18 203
5 863
9 561
1 423
886
1 457
93 080
Seasonally Adjusted
2013
August
29 915
25 531
19 572
5 791
10 160
1 432
1 025
1 474
94 899
September
29 069
25 646
18 879
5 798
10 212
1 699
895
1 420
93 618
October
28 808
25 573
18 835
5 812
10 106
1 659
931
1 467
93 191
November
29 576
26 736
18 921
6 030
9 790
1 648
934
1 533
95 167
December
30 393
26 128
19 673
5 790
10 196
1 627
923
1 556
96 286
2014
January
29 716
24 445
19 268
5 709
9 549
1 556
879
1 529
92 652
February
29 199
24 506
18 970
5 891
9 875
1 501
908
1 471
92 320
March
29 035
24 933
18 562
5 914
9 842
1 491
874
1 415
92 065
April
29 352
24 361
18 891
5 749
9 834
1 506
1 059
1 389
92 140
May
29 365
25 290
18 464
5 693
9 890
1 475
846
1 400
92 423
June
29 922
25 888
18 699
6 043
10 129
1 514
980
1 465
94 641
July
29 647
25 625
18 266
5 833
9 845
1 467
914
1 490
93 086
August
29 721
24 988
17 954
5 872
9 390
1 396
865
1 450
91 635
September
30 290
25 395
18 849
5 895
9 816
1 598
899
1 479
94 220
October
30 564
25 237
17 958
5 786
9 453
1 424
908
1 409
92 741
Original
2013
August
29 223
25 210
19 101
5 730
10 177
1 491
967
1 437
93 336
September
28 702
25 430
18 498
5 847
10 153
1 835
852
1 345
92 662
October
28 519
25 961
18 057
5 732
10 305
1 737
853
1 439
92 603
November
30 496
27 547
18 381
6 216
9 815
1 984
904
1 581
96 924
December
29 966
26 316
19 718
6 039
10 287
2 009
835
1 586
96 756
2014
January
27 080
21 289
16 660
5 082
8 707
1 280
713
1 474
82 285
February
27 585
23 411
17 367
5 567
9 427
1 263
791
1 407
86 818
March
30 656
26 311
20 073
6 184
10 117
1 457
998
1 471
97 267
April
25 625
21 108
17 041
4 897
8 604
1 182
1 070
1 183
80 710
May
29 788
26 042
19 252
5 764
9 920
1 409
978
1 409
94 562
June
37 575
31 327
24 643
7 531
12 440
1 743
1 258
1 792
118 309
July
28 587
24 756
17 767
5 514
9 556
1 302
913
1 472
89 867
August
28 404
24 184
17 169
5 618
9 137
1 418
807
1 420
88 157
September
30 388
25 670
18 890
6 099
9 882
1 734
904
1 411
94 978
October
29 839
25 559
16 990
5 628
9 534
1 488
826
1 372
91 236
(a) Seasonally adjusted numbers of new motor vehicle sales in Tasmania, Northern Territory and Australian Capital Territory should be used with caution. For more information, see paragraph 7 of the Explanatory Notes.
NOTES
FORTHCOMING ISSUES
ISSUE
Release Date
November 2014
15 December 2014
December 2014
19 January 2015
January 2015
16 February 2015
February 2015
16 March 2015
March 2015
16 April 2015
April 2015
18 May 2015
ABOUT THIS ISSUE
This issue presents details for the Sales of New Motor Vehicles for October 2014.
INQUIRIES
For further information about these and related statistics, contact the National Information and Referral Service on 1300 135 070. The ABS Privacy Policy outlines how the ABS will handle any personal information that you provide to us.
Document Selection
These documents will be presented in a new window.
 Quality Declaration
  Print Page
 Print All