SEPTEMBER KEY FIGURES
 | | Sep 2006 | Aug 2006 to Sep 2006 | Sep 2005 to Sep 2006 | |
| | '000 L | % change | % change | |
Trend estimates | |
| |
| Australian produced wine | | | | |
| Domestic wine sales | 37 409 | 1.4 | 4.7 | |
| White table wine sales | 18 865 | 1.6 | 7.7 | |
| Red and rosé table wine sales | 13 126 | 1.0 | 1.2 | |
Seasonally Adjusted | |
| |
| Australian produced wine | | | | |
| Domestic wine sales | 37 452 | - | 5.3 | |
| White table wine sales | 19 227 | 1.9 | 10.6 | |
| Red and rosé table wine sales | 12 291 | -8.9 | -4.5 | |
| |
| - nil or rounded to zero (including null cells) |
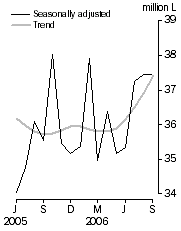
Australian produced wine, Domestic sales
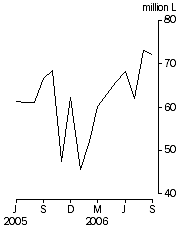
| Australian produced wine, Exports - Original
|
SEPTEMBER KEY POINTS
TREND ESTIMATES
- The trend estimate for domestic sales of Australian produced wine increased 1.4% in September 2006.
- The trend estimate for domestic sales of white table wine rose by 1.6% in September 2006. The trend for red and rosé table wine increased 1.0% on August 2006.
- The trend estimate for other wine increased 1.4% in September 2006.
SEASONALLY ADJUSTED ESTIMATES
- The seasonally adjusted estimate for domestic sales of Australian produced wine was 37.5 million litres in September 2006, which remained unchanged on August 2006.
- The seasonally adjusted estimate for white table wine increased 1.9% on August 2006, while red and rosé table wine fell 8.9%.
- The seasonally adjusted estimate for other wine increased 16.5% in September 2006.
ORIGINAL ESTIMATES
- In original terms, 39.9 million litres of Australian produced wine were sold domestically by winemakers in September 2006, a decrease of 0.7% on August 2006, but an increase of 5.0% on September 2005.
- Exports of Australian produced wine in September 2006 decreased 1.4% on August 2006 to 72.1 million litres. Australia exported 740.4 million litres with a value of $2.7 billion in the twelve months ending September 2006, an increase of 8.1% in volume, but a decease of 0.4% in value over the corresponding period to September 2005.
NOTES
FORTHCOMING ISSUES
| ISSUE | Release Date |
| October 2006 | 5 December 2006 |
| November 2006 | 10 January 2007 |
| December 2006 | 7 February 2007 |
| January 2007 | 6 March 2007 |
| February 2007 | 4 April 2007 |
| March 2007 | 9 May 2007 |
CHANGES IN THIS ISSUE
There are no changes in this issue.
DATA NOTES
There are no data notes in this issue.
ROUNDING
Where figures have been rounded, discrepancies may occur between sums of the component items and totals.
ANNUAL PRODUCTION AND INVENTORIES UPDATE
Preliminary results are now available from the 2005-06 annual wine collection which covers Australian winemakers who crushed 50 tonnes or more of grapes during the year. Results show a total of 1,364.7 million litres of beverage wine being produced in 2005-06, a decrease of 5.4% on the previous year. In the 2005-06 year, 1,852,617 tonnes of grapes were crushed, a decrease of 3.8% on the record crush of 2004-05 (1,925,490 tonnes). An estimated 1,045,918 tonnes of red grapes were crushed in 2005-06, while 806,699 tonnes of white grapes were crushed.
The scope of the inventory collection has been changed to include all winemakers who crush more than 400 tonnes annually or have domestic wine sales of 250,000 litres or more in either of the two previous years. Preliminary results for wine inventories show that at 30 June 2006, there was 2,120 million litres of wine held by Australian winemakers, a decrease of 1.5% on the 2,151 million litres held at 30 June 2005. The volume of stock held at 30 June 2006 includes 768 million litres of white wine and 1,187 million litres of red wine.
Detailed results from the 2005-06 annual wine collections will be included in the publication Australian Wine and Grape Industry, 2006 (cat. no. 1329.0), which is scheduled for release on 29 January 2006.
INQUIRIES
For further information about these and related statistics, contact the National Information and Referral Service on 1300 135 070 or Damian Sparkes on Adelaide (08) 8237 7425.
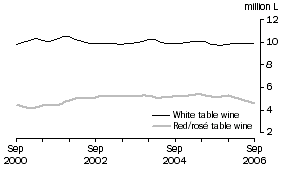
DOMESTIC AUSTRALIAN TABLE WINE SALES TREND
TOTAL WHITE AND RED/ROSÉ TABLE WINE
The trend for total sales of white table wine has increased 1.6% on August 2006, showing steady growth over the last twelve months. The trend for total red and rosé wine sales has increased for the last five months, after five months of decrease.
TOTAL WHITE AND RED/ROSÉ TABLE WINE: Trend
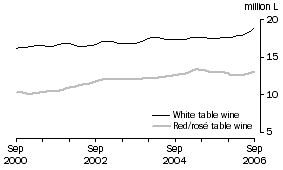
TABLE WINE, GLASS CONTAINER LESS THAN 2 LITRES
The trend estimate for sales of white table wine in glass containers of less than 2 litres increased 3.0% on August 2006, the seventh consecutive month of increase. The trend estimate for red and rosé wine sales in glass containers of less than 2 litres increased 2.2% in September 2006, the sixth consecutive month of increase.
TABLE WINE, Glass container less than 2 litres: Trend
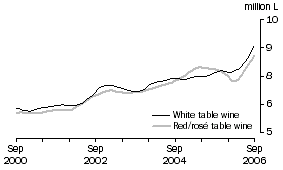
TABLE WINE, SOFT PACK CONTAINERS
The trend estimate for domestic sales of white table wine in soft packs increased 0.4% on August 2006. The trend estimate for red and rosé wine sales in soft packs has fallen for the past eight months, with a decrease of 0.9% in September 2006.
TABLE WINE, Soft pack containers: Trend
EXPORTS OF AUSTRALIAN PRODUCED WINE
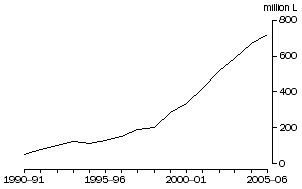
ANNUAL EXPORTS OF AUSTRALIAN PRODUCED WINE
The graph below shows that there has been steady growth in the quantity of exports of Australian produced wine over the last fifteen years. In 1990-91, 54.2 million litres of wine were exported. Exports grew rapidly to over 100 million litres in 1992-93 and between 1998-99 and 1999-2000 grew 41.8% to reach 284.9 million litres. Over the next three years there were rises of 18.7%, 23.7% and 24.0% respectively. Wine exports increased 12.7% in 2003-04 to 584.3 million litres and then rose 14.6% in 2004-05 to 669.7 million litres. Wine exports continued to rise in 2005-06, reaching 722.0 million litres, a 7.8% increase on 2004-05.
Exports of Australian produced wine, Annual totals: Original
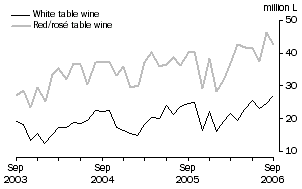
EXPORTS OF WHITE AND RED/ROSÉ TABLE WINE
In original terms, 72.1 million litres of Australian produced wine were exported in September 2006, a decrease of 1.4% on August 2006, but an increase of 8.1% on September 2005. In September 2006, 27.2 million litres of Australian produced white table wine were exported, an increase of 10.7% on August 2006 and 10.4% on September 2005. Australia exported 42.5 million litres of Australian produced red and rosé table wine in September 2006, a decrease of 8.4% on August 2006, but an increase of 5.5% on September 2005.
EXPORTS OF TABLE WINE BY TYPE: Original
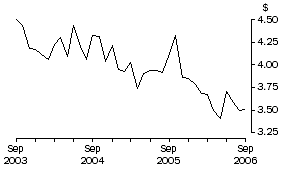
UNIT VALUE OF WINE EXPORTS
In original terms, 72.1 million litres of wine valued at $253.0m were exported in September 2006, a decrease of 1.4% in quantity and 1.0% in value on August 2006. The average value of Australian wine exported in September 2006 was $3.51 per litre, down from $4.13 per litre in September 2005, but up from $3.50 per litre in August 2006.
UNIT VALUE OF WINE EXPORTS: Original
DIFFERENCES BETWEEN ABS AND AWBC WINE EXPORT FIGURES
The value of wine exports reported in this publication is derived by the Australian Bureau of Statistics (ABS) from customs export records and the ABS converts the value on the day of shipment, at the daily conversion rate (see paragraph 10 of the Explanatory Notes for more detail). The Australian Wine and Brandy Corporation (AWBC) also report the value of exports and the exporter makes the conversion when submitting wine for export approval. With the AWBC method, it is expected that some of the conversions will occur at hedged rates. This does not occur with the ABS method. For September, the value reported by the ABS was $253.0m, while the AWBC value was $272.9m. When the Australian exchange rate is moving significantly the alternative methods will result in diverging valuations.
IMPORTS AND DISPOSALS OF AUSTRALIAN PRODUCED WINE
WINE IMPORTS CLEARED FOR HOME CONSUMPTION
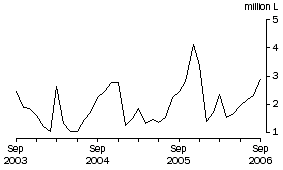
In original terms, 2.9 million litres of wine, valued at $27.0 million were imported in September 2006, an increase of 25.6% in quantity and 18.9% in value on August 2006. The average value of wine imports cleared for home consumption in September 2006 was $9.24 per litre, up from $9.07 per litre in September 2005.
WINE IMPORTS CLEARED: Original
DISPOSALS OF AUSTRALIAN PRODUCED WINE AND WINE AVAILABLE FOR CONSUMPTION IN AUSTRALIA
The original data for the September quarter 2006 shows that wine available for consumption in Australia increased 4.5% on the same quarter in 2005. Domestic sales of Australian wine increased 3.7%, and wine imports increased 18.8%. Total disposals of Australian produced wine increased by 7.5% on the same quarter in 2005 with exports increasing by 9.8%.
| Domestic sales
of Australian
produced
wine (A) | Wine imports
cleared for home
consumption (B) | Wine available
for consumption
(A + B) | Exports of
Australian
produced
wine (C) | Total disposals
of Australian
produced
wine (A + C) | |
Period | '000 L | '000 L | '000 L | '000 L | '000 L | |
| |
| 2003-04 | 417 378 | 18 737 | 436 115 | 584 319 | 1 001 697 | |
| 2004-05 | 430 131 | 22 139 | 452 270 | 669 720 | 1 099 851 | |
| 2005-06 | 431 099 | 27 164 | 458 263 | r721 986 | r1 153 085 | |
| Sep qtr 2005 | 113 172 | 6 240 | 119 412 | 188 715 | 301 887 | |
| Sep qtr 2006 | 117 385 | 7 412 | 124 797 | 207 146 | 324 531 | |
| |
| r revised |
 Print Page
 Print All