NOTES
INTRODUCTION
Venture capital is high risk capital directed towards new or young businesses with prospects of rapid growth and high rates of returns. Venture capital is an investment not only of money, but also of skills and time. This publication presents information of both financial and non-financial contributions to venture capital investments.
The growth of, and interest in, venture capital markets continues. Federal government and various state government schemes introduced to foster the sector, including changes to tax regimes, also continues.
Australian Bureau of Statistics (ABS) undertook the first survey of venture capital for the period 1999-2000 and has since undertaken this survey annually at the request of, and with the financial support of, the Department of Industry, Tourism and Resources.
ABS have conducted all surveys with the advice and assistance of users, industry bodies and data providers.
ABOUT THIS ISSUE
This issue contains the results of the 2004-05 Venture Capital survey and compares results with the five earlier surveys (1999-2000 to 2003-04). This is the fifth annual release of ABS catalogue no. 5678.0. The initial 1999-2000 survey data was first published in the Special article - Venture Capital Survey, 1999-2000 released in February 2001 in the December quarter 2000 edition of Managed Funds (ABS cat. no. 5655.0).
CHANGES IN THIS ISSUE
Electronic spreadsheet versions of the tables will be available on the Ausstats service for the first time. This issue also sees the introduction of six additional tables available in electronic format only. These additional tables contain data for 2004-05 only. Page 3 contains a list of tables available in electronic format additional to the equivalents to the printed tables.
EFFECTS OF ROUNDING
Any discrepancies between totals and sums of components in the tables are caused by rounding.
INQUIRIES
For further information about these and related statistics, contact the National Information and Referral Service on 1300 135 070 or Darren Page on Canberra (02) 6252 6731.
SUMMARY OF FINDINGS
OVERVIEW
The results of the sixth Venture Capital survey show that there was strong growth in funds committed to venture capital investment vehicles during 2004-05. As at 30 June 2005, investors had $11.2b committed to venture capital investment vehicles, an increase of 25% on the $9.0b committed as at 30 June 2004. Investors had $6.1b of committed funds drawn down at 30 June 2005, an increase of 20% on the previous year end ($5.1b at June 2004). This left $5.1b of committed funds yet to be called on, up 32% on the $3.9b of unused commitments as at June 2004. See table 1 for details. Most of the committed funds were sourced domestically, with 94% of the total investment from Australian investors (up slightly on June 2004).
While commitments and committed funds drawn down both increased strongly to the end of June 2005, the value of investments by venture capital investment vehicles at the end of 30 June 2005 ($3.5b in 912 investee companies) increased at a slower rate (14% on the $3.1b at the end of June 2004). Investments in these 912 investee companies were reported by 210 venture capital investment funds and companies (195 in 2003-04). The increase in the level of investment, derived after deduction of fees and other expenses, exits and allowing for holdings of liquid assets, was due mainly to the contribution of new and follow-on investments during 2004-05 ($1,022m, up 63% on investments made during 2003-04).
During 2004-05, the total value of all exits through trade sales, sale of shares (including IPOs) and buybacks amounted to $1,043m (representing $572m of investment and $471m profit over the life of the investments).
The selection of investee companies (into which venture capital is invested) was an intensive process. The total of 140 venture capital managers reviewed 10,199 potential new investments during 2004-05 and conducted further analysis on 1,094 of those, with 176 being sponsored for venture capital. These managers spent a total of 163,000 hours with the investee companies (179,000 in 2003-04), advising and assisting in the development of the enterprises.
The following diagram summarises key findings for venture capital in 2004-05.
KEY FIGURES 2004-05
ANALYSIS OF RESULTS
INVESTORS
Venture capital investors are generally sophisticated individual investors or organisations such as pension (superannuation) funds. Investors invest in venture capital investment vehicles which are mainly organised in the form of either trust funds or corporations. Venture capital trust funds obtain investment commitments from investors, which are drawn down over time. They must return capital plus profit (minus loss) as investments are realised. On the other hand, venture capital vehicles organised as corporations are able to choose to make distributions to investors (including parent corporations) or to retain capital for further investment. Investors in corporations may liquidate their investment by sale on the secondary market. Drawn down funding from investors in corporations can be estimated from paid up capital and borrowings, but the ability of corporations to reinvest retained earnings and the tradeability of investor equity in corporations makes analysis of investment by type of investor difficult. The concept of commitments by type of investor is less clear-cut by comparison with trust funds.
At June 2005, investors had $11.2b committed with venture capital investment vehicles. This compares with $9.0b at June 2004 and $7.5b at June 2003. See table 1 for detailed source of funds data. During 2004-05, new commitments of $2.8b to venture capital investment vehicles were made, of which $0.8b was committed by domestic pension funds. See table 14 for details.
Venture capital investment vehicles include both direct venture capital investment vehicles which place investments directly in investee companies, and fund of fund investment vehicles which mainly place investments with direct venture capital investment vehicles. At end of June 2005, $9.7b was committed to direct venture capital investment vehicles, $1.2b of which was committed via fund of fund investment vehicles. At end of June 2005, $3.7b of funds committed to direct venture capital investment vehicles was unused, $0.5b of which was committed via fund of fund investment vehicles. See table 13 for more details.
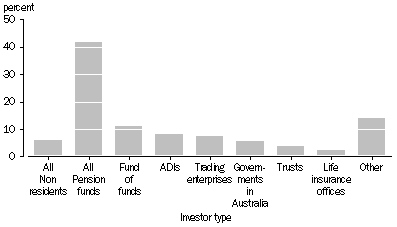
The following graph analyses drawdown investment for venture capital investors by type of investor. The graph shows that the largest source of funds in terms of drawdowns for venture capital vehicles was domestic pension funds with 42% of total drawdowns (down from 44% at June 2004) by venture capital vehicles.
DRAWDOWN INVESTMENT IN VENTURE CAPITAL FUNDS BY INVESTOR TYPE, percentage of total investment in venture capital vehicles, JUNE 2005
VENTURE CAPITAL MANAGERS AND INVESTMENT VEHICLES
The venture capital manager is generally a skilled business person and financial analyst. The gathering of commitments from investors takes a considerable amount of time as does the process of undertaking an initial evaluation of potential investees and later due diligence. The survey identified 140 active venture capital managers who were managing 210 venture capital investment vehicles. This compares with 137 active managers managing 195 vehicles in 2003-04.
Venture capital fund managers spent 163,000 hours with investee companies and received income in the form of management fees ($123m). In 2004-05, fund managers spent on average 2.5 days a month per investee company. This compares with 3.0 days in 2003-04 and 2.9 days in 2002-03. The average days spent with investee companies with Biotechnology, Pharmaceuticals and Health related activities fell, reversing the increases for the four previous years. See tables 2 and 3 for more details.
Venture capital investment vehicles had net assets of $4.2b at June 2005 compared with $3.7b in June 2004 and $3.8b in June 2003 (see table 5).
Most venture capital investment vehicles were either trusts (funds) or corporations. Of the 210 vehicles operating in 2004-05, 101 were companies, and of these, 81 were not listed with the Australian Stock Exchange. See table 6 for details.
At the end of June 2005, 94 of the 210 venture capital investment vehicles were participating in a government program, a slight increase on the number of 2004 and 2003 participants. Most of the participating investment vehicles were with the Federal government's Pooled Development Fund (PDF) program. Other significant government programs were the Innovation Investment Fund (IIF) program, the Venture Capital Limited Partnerships (VCLP) program and the Information and Communications Technology Incubator Program (ICTIP). See table 7 for details.
INVESTMENT VEHICLES BY VALUE OF ASSETS HELD
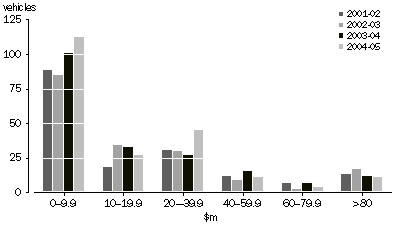
The value of total assets held by investment vehicles was widely dispersed, from 112 investment vehicles having less than $10m in assets, to 11 with more than $80m in total assets (see the preceding graph).
Table 8 shows the financial flows of venture capital investment vehicles over the survey period. New investments by venture capital investment vehicles rose strongly (up $374m, 80%) in 2004-05, increasing to $839m in 2004-05.
Most return on investment to investees is through exits from investments. There was a total of 154 investee companies exited through trade sales, sale of shares (including IPOs) and buybacks amounting to $1,043m in 2004-05 (representing $572m of investment and $471m profit over the life of the investments). This compares to the total value of all exits of $1,460m in 2003-04 (comprised of $729m of investment and $731m in profits). The value of vehicles that have dropped out of the Australian venture capital industry ($215m in 2004-05) was higher than the level recorded in the previous year and was almost the same as for 2002-03. The reasons for leaving the industry include relocation overseas, enterprises going into liquidation, or enterprises that have left venture capital for longer term private equity arrangements.
Changes in Investment, by venture capital vehicles in investees
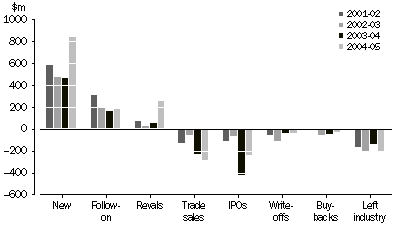
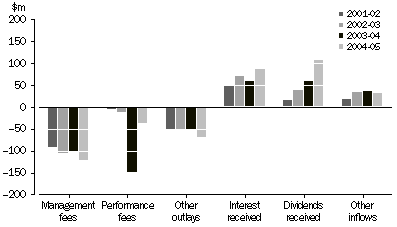
Table 4 indicates that investment vehicles had total expenditures of $233m during 2004-05, more than half of which was for management fees ($123m, compared to $105m during 2003-04). Total income increased to $221m, with the increase driven mainly by a large increase in dividends received ($58m in 2003-04 to $108m in 2004-05).
INCOME AND EXPENDITURE OF VENTURE CAPITAL VEHICLES
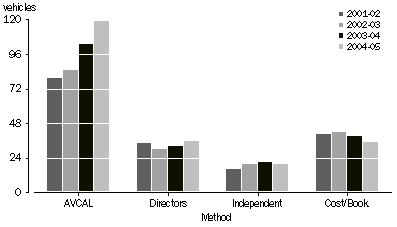
Venture capital funds used various valuation methods. The AVCAL method was most frequently used, with 119 vehicles using this method, followed by directors' valuation (36) and book value/cost valuation methods (35).
VALUATION METHODS USED BY VENTURE CAPITAL FUND VEHICLES
INVESTEE COMPANIES
Of the $3.5b that had been invested in the 912 investee companies (deals) at June 2005, $839m was invested in new projects during the 2004-05 financial year (up by $374m or 80% on 2003-04), with additional investments in existing projects of $183m (up $21m or 13%). See table 8 for more details.
NUMBER OF DEALS, by age of investee company
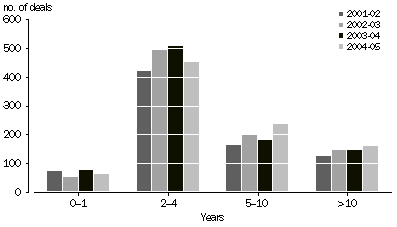
The preceding graph indicates that the number of deals by age of investee company in 2004-05 is in similar proportions to that recorded in previous years. The majority of deals remain in the 2 to 4 year category (49%). The 5 to 10 year category accounts for 26% of deals.
VALUE OF INVESTMENT, by investee stage
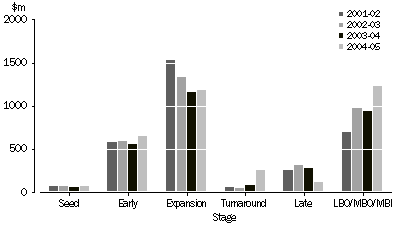
See paragraph 12 of the Explanatory Notes for a definition of the venture capital stages referred to in the above graph.
In terms of the current stage of investment, total investments in the LBO/MBO/MBI stage attracted the largest share, with $1.2b or 35% of total value as at the end of June 2005. This was mainly due to new investments during 2004-05 of $303m (see table 18 for details of investments during 2004-05 by stage). The expansion stage also increased in value, to $1.2b as at the end of June 2005.
PERCENTAGE OF INVESTEE COMPANY OWNED BY VENTURE CAPITAL VEHICLE
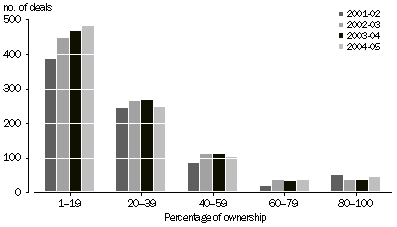
Venture capital arrangements typically do not involve a level of controlling equity by a single venture capital vehicle in investee companies, with most deals having less than 40% ownership by any one investment vehicle, as the above graph illustrates. However, it is worth noting that more than one fund manager may invest in the same investee company. For example, an investment vehicle manager may invest at the seed/start-up stage and receive 10% of the company and another investment vehicle manager could arrange the next round of funding and also receive 10% of the company.
VALUE OF INVESTMENT, by number of investees
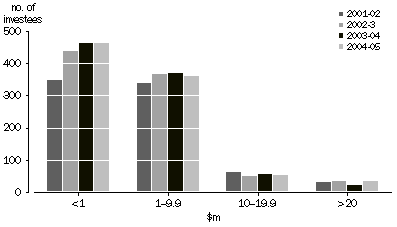
The above graph shows the distribution of value of investment placed by venture capital managers in individual investee companies. Most deals attracted less than $10m from any one investment vehicle, and the number of investees receiving less than $1m has been steadily increasing over the past four survey years. The number of investees receiving at least $20m increased from the 2003-04 level to around the level recorded for 2002-03.
PERCENTAGE OF INVESTMENT VALUE, by location of investee
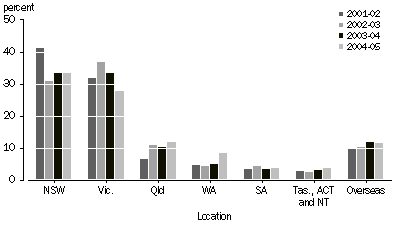
The above graph indicates that most of the venture capital funds continued to be invested in investee companies with head offices in NSW and Victoria (with 33% and 28% respectively at June 2005). NSW increased by $140m compared to June 2004, due mainly to new and follow-on investments during 2004-05 of $369m (see table 15 for details of investments during 2004-05 by location). Victoria fell (down $45m) for the second consecutive year. Overseas investment remained significant and relatively steady over the survey years.
PERCENTAGE OF TOTAL INVESTMENT, by industry of investee
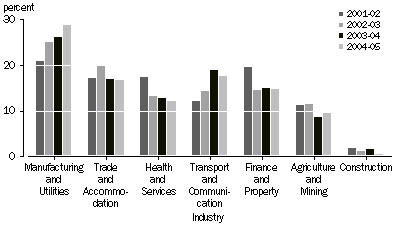
Venture capital investment was undertaken in investees in a wide range of industries and activities. Of the total value of $3.5b invested, Manufacturing and Utilities continued to be the predominant industry of investment, with investments at the end of the year of $1,015m (29% of the total, up from 26% of the total at the end of 2003-04). Most other activities recorded increases in absolute terms, but fell in terms of their share of total value (notably Transport and Communication) with the exception of Agriculture and Mining (up $69m, to 10% of total investments) and Construction. See table 10 for details of investment by industry.
PERCENTAGE OF VALUE OF INVESTMENT, by activity of investee
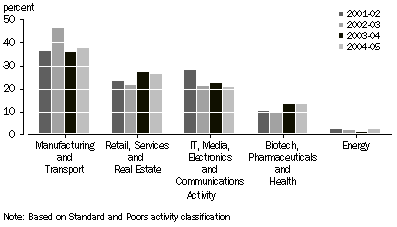
When analysed by activity, as defined by the Standard and Poors Activity Classification, Manufacturing and Transport related activities attracted the largest share of investment, with $1,323m or 38% of total investment as at the end of June 2005. Total investments in these activities rose significantly from the end of June 2005 (up $220m, 20%). Retail, Services and Real Estate with $932m (26%) and IT, Media, Electronics and Communication with $728m (21%) also attracted large shares of the total investments as at the end of June 2005.
 Print Page
 Print All