MARCH KEY FIGURES
 |  | Dec Qtr 2003 | Mar Qtr 2004 | Dec Qtr 2003 to Mar Qtr 2004 |  |
 |  | $m | $m | % change |  |
TREND ESTIMATES |  |
|  |
| Balance on current account | -12,028 | -11,862 | 1 |  |
| Balance on goods and services | -6,197 | -6,011 | 3 |  |
| Net income | -5,804 | -5,809 | - |  |
SEASONALLY ADJUSTED |  |
|  |
| Balance on current account | -11,805 | -11,997 | -2 |  |
| Balance on goods and services | -5,779 | -6,267 | -8 |  |
| Net income | -5,947 | -5,696 | 4 |  |
ORIGINAL |  |
|  |
| Balance on current account | -11,930 | -10,140 | 15 |  |
| Balance on capital and financial account | 12,248 | 10,339 | -16 |  |
Levels at end of period |  |
|  |
| Net international investment position (IIP) | 469,917 | 478,337 | 2 |  |
 | Net equity | 100,154 | 104,559 | 4 |  |
 | Net debt | 369,763 | 373,778 | 1 |  |
|  |
| - nil or rounded to zero (including null cells) |
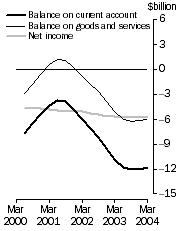
CURRENT ACCOUNT, Main aggregates - Trend estimates at current prices
| International investment, Levels at end of period

|
MARCH KEY POINTS
BALANCE OF PAYMENTS
- The current account deficit, seasonally adjusted, rose $192m to $11,997m. The deficit on the balance of goods and services rose $488m to $6,267m. The income deficit fell $251m to $5,696m.
- In seasonally adjusted chain volume terms there was an increase of $2,527m in the deficit on goods and services. This could be expected to contribute -1.3 percentage points to growth in the March quarter 2004 volume measures of GDP.
INTERNATIONAL INVESTMENT POSITION
- Australia's net IIP rose $8b to a net liability of $478b at 31 March 2004. Transactions of $10b and price changes of $1b contributed to this increase. Partially offsetting the increase were exchange rate changes of -$2b and other changes of -$1b. Net equity liabilities rose by $4b, to $105b, while net debt liabilities rose by $4b to $374b.
NOTES
CHANGES IN THIS ISSUE
Revisions
Table 34 summarises revisions, in original current price terms, since the last issue of this publication, for the last three years and six quarters.
Incorporation of the latest survey and administrative data has resulted in revisions to the current account back to September quarter 2002, increasing the 2002-03 current account deficit by $123m and decreasing the deficit for the first 6 months of 2003-04 by $317m. The financial account and international investment position have been revised back to September quarter 2002, increasing Australia's net IIP liability as at 31 December 2003 by $1,311m.
ROUNDING
Discrepancies may occur between totals in this publication and the same aggregates from other sources, and between sums of component items and totals due to rounding.
INQUIRIES
For further information contact Tom Jebbink on Canberra (02) 6252 5540 for balance of payments estimates, and Sandra Waters on Canberra (02) 6252 5541 for international investment estimates.
ANALYSIS AND COMMENTS
BALANCE OF PAYMENTS
CURRENT ACCOUNT
The trend estimate of the balance on current account for the March quarter 2004 was a deficit of $11,862m, a decrease of $166m (1%) on the deficit recorded for the December quarter 2003. The main contributors to the decrease in the deficit were goods credits, which rose $255m, and services credits, which rose $510m, partly offset by a rise in goods debits of $237m and a rise in services debits of $342m.
In seasonally adjusted terms, the current account deficit rose $192m (2%) to $11,997m in the March quarter 2004. The net deficit on goods rose $428m (7%) to $6,362m. The net services surplus fell $60m to $95m. The net deficit on income fell $251m (4%) to $5,696m.
Goods and Services
The trend estimate of the balance on goods and services at current prices was a deficit of $6,011m, a decrease of $186m (3%) on the December quarter 2003 deficit.
In seasonally adjusted current price terms, the balance on goods and services was a deficit of $6,267m. The deficit on goods was $6,362m, an increase of $428m on the deficit of $5,934m in the December quarter 2003. Higher goods imports, up $1,273m (4%), were partly offset by higher goods exports, up $845m (3%). There were increases in all commodity groups for goods debits, with intermediate and other merchandise goods up $576m (5%), consumption goods up $501m (5%) and capital goods up $177m (2%). The increase in goods credits was driven by rural goods up $682m (12%), non-rural goods with a marginal increase of $92m and other goods up $71m (4%).
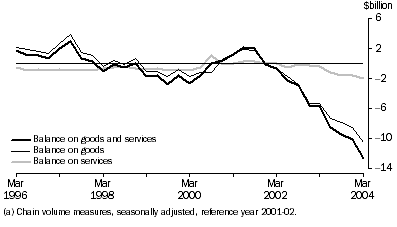
In seasonally adjusted volume terms, the deficit on goods and services was $12,684m, an increase of $2,527m on the deficit recorded for the December quarter 2003. The goods deficit rose $2,059m to $10,625m. Goods debits rose $2,920m (8%) while goods credits rose $861m (3%). The net services balance was a deficit of $2,060m, a $469m increase on the December quarter 2003 deficit.
The increase of $2,527m in the deficit on goods and services in volume terms could be expected to make a contribution to growth of -1.3 percentage points in the March quarter 2004 volume measures of GDP, assuming no significant revision to the GDP chain volume estimate for the December quarter 2003.
GOODS AND SERVICES(a)
Goods Credits
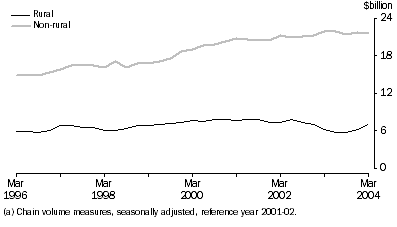
The trend estimate of goods credits rose $255m (1%) to $26,517m in the March quarter 2004. Seasonally adjusted, goods credits were $26,918m, up $845m (3%) on the December quarter 2003, driven by increases in exports of rural goods and smaller increases in non-rural and other goods.
Rural goods (seasonally adjusted, current prices) rose $682m to $6,296m, with volumes up 13% while prices fell 1%. The largest increases were in cereal grains and cereal preparations, up $399m (38%), with volumes up 42% while prices fell 3%, meat and meat preparations, up $124m (9%), with volumes up 7% and prices up 2%, and in other rural goods, up $143m (6%) due to increased volumes.
Non-rural goods (seasonally adjusted, current prices) rose $92m to $18,634m with volumes down less than 1% and prices up less than 1%. The largest increases were in transport equipment, up $82m (7%), with volumes up 9% and prices down 2%, other manufactures, up $90m (3%), driven by price increases, and machinery, up $70m (4%), with volumes up 7% while prices fell 2%. Offsetting these increases was a fall in exports of metal ores and minerals, down $122m (3%), due to decreased volumes.
Other goods (seasonally adjusted, current prices) recorded an increase, up $71m (4%), driven by goods for processing, up $106m (44%).
GENERAL MERCHANDISE CREDITS(a)
Goods Debits
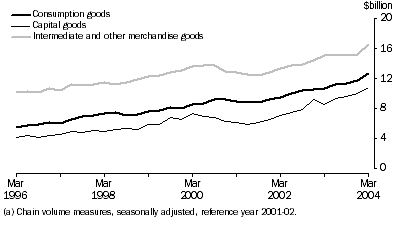
The trend estimate of goods debits rose $237m (1%) to $32,680m in the March quarter 2004. In seasonally adjusted current price terms, goods debits rose $1,273m (4%) to $33,280m.
Consumption goods imports (seasonally adjusted, current prices) rose $501m (5%) to $10,913m, with a rise in volumes of 7% and a fall in prices of 2%. This increase was driven by non-industrial transport equipment, up $283m (10%), due to an increase in volumes, consumption goods n.e.s., up $274m (9%), driven by an increase in volumes, and household electrical items, up $68m (7%) with volumes up 13% while prices fell 5%. Offsetting these increases was a fall in toys, books and leisure goods, down $102m (11%), with volumes and prices both down 6%.
Intermediate and other merchandise goods and other goods (seasonally adjusted, current prices) rose $595m (4%) to $14,455m, driven by a rise in volumes. The largest increases were in fuels and lubricants, up $508m (24%), with volumes up 30% while prices fell 4%, other merchandise goods, up $112m (45%), with volumes up 53% while prices fell 5%, and in non-monetary gold, up $82m (49%), with volumes up 53% while prices fell 2%. Offsetting these increases were falls in organic and inorganic chemicals, down $95m (12%), with volumes down 11% and prices down 1% and goods for processing, down $47m (5%) with volumes down 5% and prices down 1%.
Capital goods imports (seasonally adjusted, current prices) rose $177m (2%) to $7,912m, with a rise in volumes of 7% while prices fell 5%. The largest increases were in telecommunications equipment, up $233m (25%), with volumes up 32% while prices fell 5%, industrial transport equipment n.e.s., up $111m (11%), with volumes up 13% while prices fell 2%, and in machinery and industrial equipment, up $105m (4%), with volumes up 5% while prices fell 1%. Offsetting these increases was a fall in imports of civil aircraft, down $406m (47%), with volumes down 44% and prices down 5%.
GENERAL MERCHANDISE DEBITS(a)
Services
The trend estimate of net services in the March quarter 2004 was a surplus of $152m, a turnaround of $168m on the December quarter 2003 deficit of $16m. In seasonally adjusted terms, net services recorded a surplus of $95m, a decrease of $60m on the surplus of $155m for the December quarter 2003.
Services credits, in seasonally adjusted terms at current prices, rose $45m (1%) to $8,819m, due mainly to an increase in prices. Services debits, in seasonally adjusted terms at current prices, rose $105m (1%) to $8,724m, with prices down 3% and volumes up 5%. The largest increase in services credits was in other services and for service debits in passenger and other transportation services, largely due to increased international travel.
Implicit Price Deflator
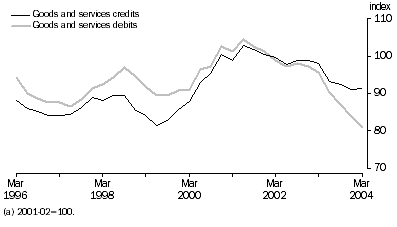
In seasonally adjusted terms, the implicit price deflator (IPD) for total goods and services credits rose 0.3%. In original terms, it rose 1.3%. The chain Laspeyres price index for goods and services credits rose 0.4%, indicating that compositional effects had an upward influence on the movement in the IPD. The IPD for goods credits rose 0.7% and the IPD for services credits rose 0.8%.
The total goods and services debits IPD fell 3.3% in seasonally adjusted terms. In original terms, it fell 3.5%. The chain Laspeyres price index for debits fell 3.5%.
IMPLICIT PRICE DEFLATOR, (a)
Relationship to IPI and EPI
Both the goods export IPD (in original terms) and the chain Laspeyres price index for goods exports rose 0.7%. The exports price index (EPI) remained steady during the March quarter 2004.
During the March quarter 2004, the goods imports IPD (in original terms) fell 3.5% and the chain Laspeyres price index for goods imports fell 3.4%. The import price index (IPI) fell 4.1%.
Income
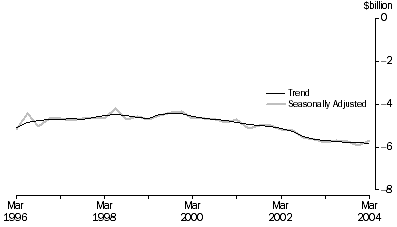
The trend estimate of the net income deficit rose $5m to $5,809m.
In seasonally adjusted terms, the net income deficit fell $251m (4%) to $5,696m. Income credits fell $51m (1%) to $3,665m and income debits fell $302m (3%) to $9,361m.
In original terms, income credits fell $134m (3%) to $3,696m and income debits rose $570m (6%) to $9,660m.
Net income
Current Transfers
In seasonally adjusted terms, net current transfers was a deficit of $34m, a decrease of $45m on the $79m deficit recorded in the December quarter 2003. Current transfer credits rose $34m (3%) and debits fell $11m (1%).
CAPITAL AND FINANCIAL ACCOUNT
Capital Account
In original terms, the capital account surplus was $214m, down $93m on the December quarter 2003 surplus. Capital transfer credits fell $28m (4%) to $633m and capital transfer debits rose $28m (8%) to $391m.
Financial Account
In original terms, the balance on the financial account recorded a net inflow of $10.1b, with a $7.7b inflow on debt and a $2.5b inflow on equity.
Direct investment in Australia recorded an inflow of $0.5b in the March quarter 2004, a $1.7b decrease on the December quarter inflow of $2.2b. Australia's direct investment abroad recorded an outflow of $3.6b, down $12.0b on the previous quarter's outflow of $15.6b. This was the thirteenth consecutive quarterly outflow, bringing the total outflow on Australia's direct investment abroad to $66.1b from the March quarter 2001.
Portfolio investment recorded a net inflow of $15.9b, down $8.9b on the net inflow of $24.8b in the December quarter 2003. Large debt security issues were made to fund maturing debt, roll-over existing debt and to move domestic issues offshore to take advantage of interest rate differentials. Offsetting this to an extent were large bond issues by non-residents in the Australian market.
Other investment recorded a net outflow of $0.4b, a turnaround of $5.4b on the net inflow of $5.0b recorded in the December quarter 2003.
Reserve assets recorded a net outflow of $2.1b, due to an increase in foreign exchange reserves. This was a decrease of $2.4b on the previous quarter's outflow of $4.4b.
INTERNATIONAL INVESTMENT POSITION
INTERNATIONAL INVESTMENT
Australia's net international investment position at 31 March 2004 was a net foreign liability of $478.3b, up $8.4b on 31 December 2003. The increase consisted of:
- net transactions of $10.1b
- price changes of $1.2b
- exchange rate changes of -$2.2b
- other adjustments of -$0.8b
During the March quarter 2004, the level of net debt liabilities rose $4.0b (1.1%) to $373.8b. New debt raisings of $7.7b and price changes of $0.9b were major contributors to this increase, partially offset by exchange rate and other changes of -$4.5b.
During the March quarter 2004, the level of net equity liabilities rose $4.4b (4.4%) to $104.6b.
As at 31 March 2004, the ratio of Australia's net IIP to GDP using the latest available GDP (for the year ending 31 December 2003) was 63.8%. This compares with 59.4% one year ago and 52.6% a decade ago.
 Print Page
 Print All