AUGUST KEY FIGURES
 | June 2004 | July 2004 | August 2004 | Jul 04 to Aug 04 |  |
 | $m | $m | $m | % change |  |
Trend |  |
|  |
| Balance on goods & services | -2,050 | -2,136 | -2,202 | . . |  |
| Credits (exports of goods & services) | 12,940 | 13,096 | 13,219 | 1 |  |
| Debits (imports of goods & services) | 14,990 | 15,232 | 15,421 | 1 |  |
Seasonally Adjusted |  |
|  |
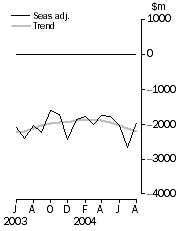
| Balance on goods & services | -2,025 | -2,666 | -1,932 | . . |  |
| Credits (exports of goods & services) | 13,434 | 12,905 | 12,884 | - |  |
| Debits (imports of goods & services) | 15,459 | 15,571 | 14,816 | -5 |  |
|  |
| . . not applicable |
| - nil or rounded to zero (including null cells) |
Balance on goods and services
|  |
AUGUST KEY POINTS
TREND ESTIMATES
- The provisional trend estimate of the balance on goods and services was a deficit of $2,202m in August 2004, an increase of $66m on the deficit in July.
- Goods and services credits rose $123m (1%) to $13,219m. Non-rural and other goods rose $96m (1%) and rural goods rose $14m (1%). Services credits rose $13m.
- Goods and services debits rose $189m (1%) to $15,421m. Capital goods rose $84m (3%), intermediate and other goods rose $65m (1%) and consumption goods rose $20m (1%). Services debits rose $20m (1%).
SEASONALLY ADJUSTED ESTIMATES
- In seasonally adjusted terms, the balance on goods and services was a deficit of $1,932m in August, a decrease of $734m on the deficit in July.
- Goods and services credits fell $21m to $12,884m. Rural goods fell $220m (9%) while non-rural and other goods rose $210m (3%). Services credits fell $11m.
- Goods and services debits fell $755m (5%) to $14,816m. Capital goods fell $364m (11%), intermediate and other goods fell $238m (4%) and consumption goods fell $177m (5%). Services debits rose $24m (1%).
ORIGINAL ESTIMATES
- In original terms, the August balance on goods and services was a deficit of $2,289m, an increase of $249m on the deficit in July. Goods and services credits fell $429m (3%), while goods and services debits fell $180m (1%).
- In the two months to August, exports of non-rural and other goods were up $1.5b (11%) and rural goods were up $1.2b (36%) on the corresponding period in 2003-04.
NOTES
REVISIONS TO HISTORICAL DATA
Historical revisions were made to incorporate the latest available data relating to merchandise trade and the quarterly Survey of International Trade in Services. In original terms, these revisions have:
- decreased the deficit on goods and services for July 2004 by $109m
- decreased the deficit on goods and services for 2003-04 by $277m.
CHANGES TO FORTHCOMING ISSUES
Seasonally adjusted and trend estimates of the balance on goods and services will be revised in the October 2004 issue of this publication as a result of the annual seasonal re-analysis. These revised forward seasonal factors are released as part of the electronic versions of the relevant publications (see 5368.0, Table 20, for monthly seasonal factors, and 5302.0, Table 95, for quarterly seasonal factors).
As foreshadowed in the July 2004 issue of this publication, commencing with the October 2004 issue, the ABS will introduce concurrent adjustment for seasonally adjusted indicators to improve the accuracy and consistency of the seasonally adjusted estimates. When the concurrent seasonal adjustment method is applied to the latest data up to August 2004, the movement in the balance of goods and services is of similar magnitude and composition to that obtained using the forward factors method.
FEATURE ARTICLE
A feature article about the Implementation of New Customs Systems has been released on the ABS web site <https://www.abs.gov.au> concurrently with the release of this publication. The Australian Customs Service will cutover to its new Integrated Cargo System for the lodgement of records relating to export transactions on 6 October 2004. This article outlines the changes and summarises the expected implications for merchandise export statistics compiled by the ABS.
To access this article on the web site select: Themes then International Trade then Topics of Interest
CAUTIONARY NOTE
The tables in this publication are presented on two bases. Tables 1-7 contain estimates of Australia's international trade in goods and services which have been adjusted for coverage, valuation and timing to a balance of payments basis. Tables 8-11 contain estimates of merchandise exports and imports based on Australian Customs Service records. Paragraph 5 of the Explanatory Notes provides an explanation of the difference between these bases.
INQUIRIES
For further information about these and related statistics, contact the National Information and Referral Service on 1300 135 070 or Artur Andrysiak on (02) 6252 6792.
ANALYSIS AND COMMENTS
BALANCE ON GOODS AND SERVICES
The trend estimate of the balance on goods and services in August 2004 was a deficit of $2,202m, an increase of $66m on the deficit in July.
In seasonally adjusted terms, the balance on goods and services in August 2004 was a deficit of $1,932m, a decrease of $734m on the deficit in July.
EXPORTS OF GOODS AND SERVICES
The trend estimate of goods and services credits rose $123m (1%) in August to $13,219m.
In seasonally adjusted terms, goods and services credits fell $21m in August to $12,884m. Rural goods fell $220m (9%), services credits fell $11m, while non-rural and other goods rose $210m (3%).
Exports of goods
GOODS CREDITS
Rural goods
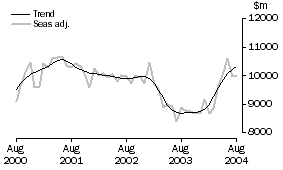
The trend estimate of rural goods exports rose $14m (1%) to $2,479m.
In seasonally adjusted terms, rural goods fell $220m (9%) to $2,247m.
In original terms, rural goods fell $126m (5%) to $2,254m.
Movements in the original series contributing to the fall in the seasonally adjusted terms were:
- cereal grains and cereal preparations, down $115m (19%), in contrast to an average July to August rise of 15% over the previous three years
- wool and sheepskins, down $52m (21%), compared with an average July to August fall of 6% over the previous three years
- meat and meat preparations, down $23m (4%), compared with an average July to August fall of 1% over the previous three years.
Partly offsetting these effects were rises in exports of other rural, up $64m (7%), compared with an average July to August rise of 4% over the previous three years.
Non-rural and other goods
The trend estimate of non-rural and other goods exports rose $96m (1%) to $7,849m.
In seasonally adjusted terms, non-rural and other goods rose $210m (3%) to $7,730m.
In original terms, non-rural and other goods rose $402m (5%) to $8,131m.
Movements in the original series contributing to the rise in the seasonally adjusted terms were:
- coal, coke and briquettes, up $202m (17%), compared with an average July to August rise of 3% over the previous three years
- metal ores and minerals, up $135m (10%), in contrast to an average July to August fall of less than 1% over the previous three years
- other non-rural, up $119m (16%), compared with an average July to August rise of 7% over the previous three years.
Partly offsetting these effects were exports of transport equipment, down $43m (10%), in contrast to an average July to August rise of 20% over the previous three years.
Exports of services
SERVICES CREDITS
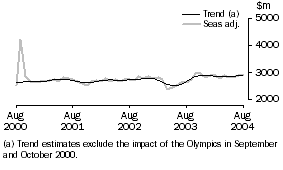
In trend terms, services credits rose $13m to $2,891m.
Seasonally adjusted, services credits fell $11m to $2,907m.
Movements in the seasonally adjusted components contributing to this fall were:
- passenger and other transportation services, down $20m (3%)
- freight transportation services, down $1m (1%).
Partly offsetting these effects was travel services, up $10m (1%).
Seasonally adjusted, tourism related services credits fell $15m (1%).
IMPORTS OF GOODS AND SERVICES
The trend estimate of goods and services debits rose $189m (1%) in August to $15,421m.
In seasonally adjusted terms, goods and services debits fell $755m (5%) to $14,816m.
Capital goods fell $364m (11%), intermediate and other goods fell $238m (4%), consumption goods fell $177m (5%), while services debits rose $24m (1%).
Imports of goods
GOODS DEBITS
Consumption goods
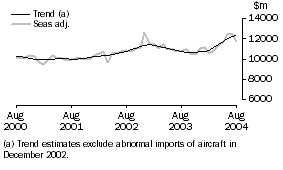
The trend estimate of imports of consumption goods rose $20m (1%) to $3,872m.
In seasonally adjusted terms, imports of consumption goods fell $177m (5%) to $3,658m.
In original terms, imports of consumption goods fell $56m (1%) to $3,939m.
Movements in the original series contributing to the fall in the seasonally adjusted terms were:
- non-industrial transport equipment, down $171m (16%), compared with an average July to August fall of 10% over the previous three years
- household electrical items, down $13m (3%), in contrast to an average July to August rise of 10% over the previous three years.
Partly offsetting these effects was consumption goods n.e.s., up $61m (5%), compared with an average July to August rise of 2% over the previous three years.
Capital goods
The trend estimate of imports of capital goods rose $84m (3%) to $3,128m.
In seasonally adjusted terms, imports of capital goods fell $364m (11%) to $2,886m.
In original terms, imports of capital goods fell $289m (9%) to $2,939m.
Movements in the original series contributing to the fall in the seasonally adjusted terms were:
- civil aircraft, down $348m (75%), in contrast to strong July to August rises over the previous three years
- industrial transport equipment n.e.s., down $73m (16%), compared with an average July to August fall of 3% over the previous three years.
Partly offsetting these effects were:
- capital goods n.e.s., up $28m (7%), in contrast to an average July to August fall of 1% over the previous three years
- telecommunications equipment, up $42m (10%), compared with an average July to August rise of 3% over the previous three years.
Intermediate and Other Goods
The trend estimate of imports of intermediate and other goods rose $65m (1%) to $5,389m.
In seasonally adjusted terms, intermediate and other goods imports fell $238m (4%) to $5,238m.
In original terms, imports of intermediate and other goods rose $206m (4%) to $5,416m.
Movements in the original series contributing to the fall in the seasonally adjusted terms were:
- fuels and lubricants, down $48m (5%), in contrast to an average July to August rise of 16% over the previous three years
- organic and inorganic chemicals, down $41m (14%), in contrast to an average July to August rise of 16% over the previous three years
- other merchandise goods, up $17m (25%), compared with an average July to August rise of 54% over the previous three years.
An adjustment made as part of the regular seasonal adjustment process to take into account different trading day patterns in July and August contributed about 1 percentage point towards the overall fall.
Partly offsetting these effects were:
- other parts for capital goods, up $92m (12%), in contrast to an average July to August fall of 4% over the previous three years
- other goods, up $87m (24%), compared with an average July to August rise of 4% over the previous three years.
Imports of services
SERVICES DEBITS
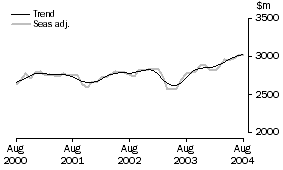
In trend terms, services debits rose $20m (1%) to $3,032m.
Seasonally adjusted, services debits rose $24m (1%) to $3,034m.
Movements in the seasonally adjusted components contributing to this rise were:
- other services, up $16m (2%)
- passenger and other transportation services, up $15m (3%)
- travel services, up $9m (1%).
Partly offsetting these effects was freight transportation services, down $16m (3%).
Seasonally adjusted, tourism related services debits rose $73m (5%).
 Print Page
 Print All