MARCH KEY FIGURES
 | | Mar 2007 | Feb 2007 to Mar 2007 | Mar 2006 to Mar 2007 |
| | '000 L | % change | % change |
Trend estimates |
|
| Australian produced wine | | | |
| Domestic wine sales | 38 174 | 0.5 | 6.5 |
| White table wine sales | 18 262 | 0.3 | 2.6 |
| Red and rosé table wine sales | 14 094 | 1.0 | 12.0 |
Seasonally Adjusted |
|
| Australian produced wine | | | |
| Domestic wine sales | 37 986 | -2.8 | 7.3 |
| White table wine sales | 18 140 | -5.3 | 2.5 |
| Red and rosé table wine sales | 13 799 | -2.4 | 12.5 |
|
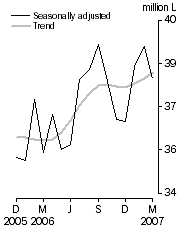
Australian produced wine,
Domestic sales
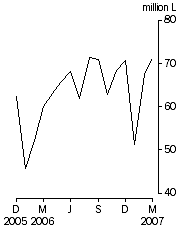
| Australian produced wine,
Exports - Original
|
MARCH KEY POINTS
TREND ESTIMATES
- The trend estimate for domestic sales of Australian produced wine increased 0.5% in March 2007.
- The trend estimate for domestic sales of white table wine increased by 0.3% in March 2007. The trend for red and rosé table wine increased 1.0% on February 2007.
- The trend estimate for other wine increased by 0.3% on February 2007.
SEASONALLY ADJUSTED ESTIMATES
- The seasonally adjusted estimate for domestic sales of Australian produced wine was 38.0 million litres in March 2007, a decrease of 2.8% on February 2007.
- The seasonally adjusted estimate for white table wine decreased 5.3% on February 2007, while red and rosé table wine decreased by 2.4%.
- The seasonally adjusted estimate for other wine increased 4.3% in March 2007.
ORIGINAL ESTIMATES
- In original terms, 36.7 million litres of Australian produced wine were sold domestically by winemakers in March 2007, an increase of 12.3% on February 2007 and 2.8% on March 2006.
- Exports of Australian produced wine in March 2007 increased 5.7% on February 2007 to 71.2 million litres. Australia exported 792.6 million litres with a value of $2.8 billion in the twelve months ending March 2007, an increase of 12.5% in volume and 3.3% in value over the corresponding period to March 2006.
NOTES
FORTHCOMING ISSUES
| ISSUE | Release Date |
| April 2007 | 6 June 2007 |
| May 2007 | 5 July 2007 |
| June 2007 | 7 August 2007 |
| July 2007 | 5 September 2007 |
| August 2007 | 4 October 2007 |
| September 2007 | 7 November 2007 |
CHANGES IN THIS ISSUE
There are no changes in this issue.
DATA NOTES
There are no data notes in this issue.
ROUNDING
Where figures have been rounded, discrepancies may occur between sums of the component items and totals.
INQUIRIES
For further information about these and related statistics, contact the National Information and Referral Service on 1300 135 070 or Damian Sparkes on Adelaide (08) 8237 7425.
 Print Page
 Print All