APRIL KEY FIGURES
 |  | Apr 09 | Mar 09 to Apr 09 | Apr 08 to Apr 09 |
 |  | no. | % change | % change |
|
| TREND |  |  |  |
 | Total dwelling units approved | 10 590 | 2.2 | -18.9 |
 | Private sector houses | 7 578 | 2.0 | -13.7 |
 | Private sector other dwellings | 2 671 | 2.1 | -33.0 |
| SEASONALLY ADJUSTED |  |  |  |
 | Total dwelling units approved | 11 402 | 5.1 | -16.1 |
 | Private sector houses | 8 014 | 7.2 | -8.5 |
 | Private sector other dwellings | 2 987 | -1.4 | -34.0 |
|
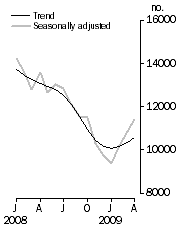
Dwelling units approved

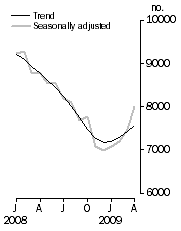
| Private sector houses approved

|
APRIL KEY POINTS
TOTAL DWELLING UNITS
- The trend estimate for total dwelling units approved rose 2.2% in April 2009 and is now showing rises for three months.
- The seasonally adjusted estimate for total dwelling units approved rose 5.1% and has risen for three months.
PRIVATE SECTOR HOUSES
- The trend estimate for private sector houses approved rose 2.0% in April and has risen for the last four months.
- The seasonally adjusted estimate for private sector houses approved rose 7.2% and has risen for four months.
PRIVATE SECTOR OTHER DWELLING UNITS
- The trend estimate for private sector other dwellings approved rose 2.1% in April.
- The seasonally adjusted estimate for private sector other dwellings approved fell 1.4%.
VALUE OF BUILDING APPROVED
- The trend estimate for the value of total building approved rose 1.4% in April. The trend estimates for the value of new residential building and alterations and additions approved rose 0.3% and 1.7% respectively. The trend estimate for the value of non-residential building approved rose 2.6%.
- The seasonally adjusted estimate for the value of total building approved fell 1.9% in April. The seasonally adjusted estimates for the value of new residential building and alterations and additions approved rose 1.7% and 9.2% respectively. The seasonally adjusted estimate for the value of non-residential building fell 8.6%.
NOTES
FORTHCOMING ISSUES
| ISSUE | Release Date |
| May 2009 | 1 July 2009 |
| June 2009 | 30 July 2009 |
| July 2009 | 1 September 2009 |
| August 2009 | 30 September 2009 |
| September 2009 | 4 November 2009 |
| October 2009 | 1 December 2009 |
CHANGES IN THIS ISSUE
There are no changes in this issue.
REVISIONS THIS MONTH
Revisions to the total number of dwelling units approved in this issue are:
 | 2007-08 | 2008-09 | TOTAL |
|
| NSW | - | 27 | 27 |
| Vic. | - | 1 | 1 |
| Qld | 1 | 404 | 405 |
| SA | - | 12 | 12 |
| WA | - | 37 | 37 |
| Tas. | - | 19 | 19 |
| NT | - | 2 | 2 |
| ACT | - | -1 | -1 |
| Total | 1 | 501 | 502 |
|
DATA NOTES
There are no notes about the data.
INQUIRIES
For further information about these and related statistics, contact the National Information and Referral Service on 1300 135 070 or Paul Pamment on Adelaide (08) 8237 7648.
 Quality Declaration
  Print Page
 Print All