DECEMBER KEY FIGURES
 | October
2006 | November
2006 | December
2006 | Nov 06
to Dec 06 |  |
 | $m | $m | $m | % change |  |
TREND |  |
|  |
| Balance on goods and services | -941 | -1 074 | -1 273 | . . |  |
| Credits (exports of goods & services) | 17 849 | 17 846 | 17 791 | - |  |
| Debits (imports of goods & services) | 18 790 | 18 920 | 19 064 | 1 |  |
SEASONALLY ADJUSTED |  |
|  |
| Balance on goods and services | -1 486 | -897 | -1 336 | . . |  |
| Credits (exports of goods & services) | 17 935 | 17 901 | 17 781 | -1 |  |
| Debits (imports of goods & services) | 19 421 | 18 799 | 19 118 | 2 |  |
|  |
| . . not applicable |
| - nil or rounded to zero (including null cells) |
Balance on goods and services
|  |
DECEMBER KEY POINTS
TREND ESTIMATES
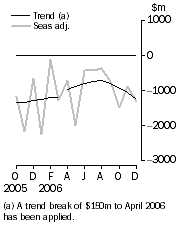
- The provisional trend estimate of the balance on goods and services was a deficit of $1,273m in December 2006, an increase of $199m on the revised deficit in November.
- Goods and services credits fell $55m to $17,791m. Goods and services debits rose $144m (1%) to $19,064m.
SEASONALLY ADJUSTED ESTIMATES
- In seasonally adjusted terms, the balance on goods and services was a deficit of $1,336m in December, an increase of $439m on the revised deficit in November.
- Goods and services credits fell $120m (1%) to $17,781m. Rural goods fell $92m (4%) and non-rural and other goods fell $47m. Services credits rose $19m (1%).
- Goods and services debits rose $319m to $19,118m. Capital goods rose $206m (6%), intermediate and other goods rose $135m (2%) and consumption goods fell $29m (1%). Services debits rose $8m.
ORIGINAL ESTIMATES
- In original terms, the December balance on goods and services was a deficit of $100m, a decrease of $1,542m on the revised deficit in November. Goods and services credits rose $671m (4%) while goods and services debits fell $871m (4%).
- The 2006 calendar year deficit on goods and services was $11,645m. The goods deficit was $12,648m while the services surplus was $1,003m.
NOTES
FORTHCOMING ISSUES
| ISSUE | Release Date |
| January 2007 | 6 March 2007 |
| February 2007 | 3 April 2007 |
| March 2007 | 4 May 2007 |
| April 2007 | 31 May 2007 |
| May 2007 | 4 July 2007 |
| June 2007 | 1 August 2007 |
REVISIONS
Revisions were made to incorporate the latest available data relating to merchandise trade and the quarterly Survey of International Trade in Services. In original terms, these revisions have:
- increased the deficit on goods and services for November 2006 by $40m
- decreased the deficit on goods and services for 2005-06 by $135m.
CHANGES TO THIS ISSUE
In both the seasonally adjusted and trend data presented in this publication, aggregate sub-totals and totals may not exactly equal the sum of their components due to rounding. The previous process was to generate sub-totals and totals as the sum of the rounded components.
CHANGES TO EXPORT AND IMPORT STATISTICAL CODES
As advised in the previous issue, statistical codes in the Australian Harmonized Export Commodity Classification (AHECC) and the Customs Tariff will be revised with the January 2007 issue of this publication. The changes result from the implementation of an update to the international Harmonized Commodity Description and Coding System. The changes will not impact directly on the presentation of statistics in this publication but will impact on detailed import and export statistics provided via ABS Client Services.
More information about these changes is available from the ABS web site Information Paper: Changes on 1 January 2007 to Statistical Codes in the AHECC and the Customs Tariff, 2007 (cat. no. 1233.0.55.001). Included with the information paper are correspondences between the codes of the current and the updated versions of the AHECC and the Customs Tariff, and correspondences between the updated versions of the AHECC and the Customs Tariff, and related classifications. The correspondences can be used by clients to understand the impact on statistics.
FEATURE ARTICLE
A feature article on Australia's International Trade in Services by Partner Country, 2006, Preliminary, will be released on the ABS web site on 12 February 2007. The article provides preliminary calendar year data for 2006 for Australia's international trade in services with selected major trading partners. As the data is preliminary, care should be exercised in interpreting the data. More comprehensive and updated estimates for 2006 will be published with the March 2007 issue of International Trade in Goods and Services, Australia (cat. no. 5368.0).
INQUIRIES
For further information about these and related statistics, contact the National Information and Referral Service on 1300 135 070 or Tom Jebbink on Canberra (02) 6252 5540.
SUMMARY COMMENTARY
BALANCE ON GOODS AND SERVICES
The trend estimate of the balance on goods and services in December 2006 was a deficit of $1,273m, an increase of $199m on the deficit in November.
In seasonally adjusted terms, the balance on goods and services in December 2006 was a deficit of $1,336m, an increase of $439m on the deficit in November.
The sum of the seasonally adjusted balances for the three months to December 2006 was a deficit of $3,719m, an increase of $2,140m on the deficit of $1,579m for the three months to September 2006. However, if the seasonal factors used in compiling quarterly Balance of Payments are applied, the December quarter 2006 deficit was $3,554m, an increase of $2,089m on the revised September quarter 2006 deficit of $1,465m.
EXPORTS OF GOODS AND SERVICES
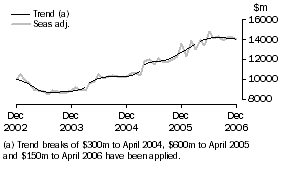
The trend estimate of goods and services credits fell $55m between November and December to $17,791m.
In seasonally adjusted terms, goods and services credits fell $120m (1%) to $17,781m. Non-rural goods fell $237m (2%), rural goods fell $92m (4%) while other goods rose $190m (23%). Services credits rose $19m (1%).
Exports of goods
GOODS CREDITS
RURAL GOODS
The trend estimate of rural goods exports fell $14m (1%) to $2,189m.
In seasonally adjusted terms, exports of rural goods fell $92m (4%) to $2,130m.
The main components contributing to the fall in the seasonally adjusted estimates were:
- other rural, down $70m (7%)
- cereal grains and cereal preparations, down $33m (9%).
Partly offsetting these effects was wool and sheepskins, up $12m (5%).
In original terms, exports of rural goods rose $15m (1%) to $2,228m.
NON-RURAL GOODS
The trend estimate of non-rural goods exports fell $29m to $10,891m.
In seasonally adjusted terms, exports of non-rural goods fell $237m (2%) to $10,843m.
The main components contributing to the fall in the seasonally adjusted estimates were:
- other non-rural, down $177m (13%)
- other manufactures, down $138m (10%)
- coal, coke and briquettes, down $31m (2%).
Partly offsetting these effects were:
- metals (excl. gold), up $87m (7%)
- metal ores and minerals, up $19m (1%).
In original terms, exports of non-rural goods rose $526m (5%) to $11,514m.
OTHER GOODS
The trend estimate of other goods exports fell $26m (3%) to $923m.
In seasonally adjusted terms, exports of other goods rose $190m (23%) to $1,028m.
The main component contributing to the rise in the seasonally adjusted series was non-monetary gold, up $223m (33%), partly offset by goods for processing, down $38m (73%).
In original terms, exports of other goods rose $186m (22%) to $1,022m.
Exports of services
SERVICES CREDITS
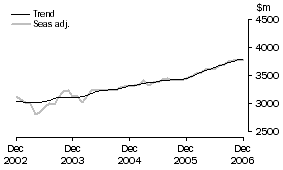
In trend terms, services credits rose $14m to $3,788m.
Seasonally adjusted, services credits rose $19m (1%) to $3,780m.
All components contributed to the rise in the seasonally adjusted series where the main contributor was travel services, up $14m (1%).
Seasonally adjusted, tourism related services credits rose $6m to $2,411m.
IMPORTS OF GOODS AND SERVICES
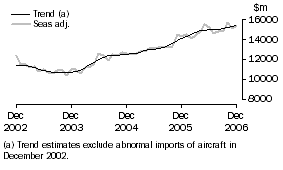
The trend estimate of goods and services debits rose $144m between November and December to $19,064m.
In seasonally adjusted terms, goods and services debits rose $319m (2%) to $19,118m. Capital goods rose $206m (6%), intermediate and other merchandise goods rose $100m (2%), other goods rose $35m (7%) while consumption goods fell $29m (1%). Services debits rose $8m.
Preliminary analysis shows that goods imports volumes, in seasonally adjusted terms, increased about 7.3% during the December quarter 2006. The original Chain Laspeyres price index fell about 3.1% and the implicit price deflator fell about 2.7%. The final volume and price outcomes will be published in the December quarter 2006 issue of Balance of Payments and International Investment Position, Australia (cat. no. 5302.0).
Imports of goods
GOODS DEBITS
CONSUMPTION GOODS
The trend estimate of imports of consumption goods rose $43m (1%) to $4,648m.
In seasonally adjusted terms, imports of consumption goods fell $29m (1%) to $4,629m.
The main component contributing to the fall in the seasonally adjusted estimates was food and beverages, mainly for consumption, down $48m (7%).
In original terms, imports of consumption goods fell $798m (16%) to $4,344m.
CAPITAL GOODS
The trend estimate of imports of capital goods rose $59m (2%) to $3,479m.
In seasonally adjusted terms, imports of capital goods rose $206m (6%) to $3,568m.
The components contributing to the rise in the seasonally adjusted estimates were:
- civil aircraft, up $222m
- ADP equipment, up $32m (6%).
Partly offsetting these effects were:
- machinery and industrial equipment, down $38m (3%)
- capital goods n.e.s., down $14m (3%).
In original terms, imports of capital goods fell $77m (2%) to $3,546m.
INTERMEDIATE AND OTHER MERCHANDISE GOODS
The trend estimate of imports of intermediate and other merchandise goods rose $36m (1%) to $6,648m.
In seasonally adjusted terms, imports of intermediate and other merchandise goods rose $100m (2%) to $6,702m.
The main components contributing to the rise in the seasonally adjusted estimates were:
- fuels and lubricants, up $352m (23%), with volumes of crude oil imports up 39%
- other merchandise goods, up $67m (75%)
- processed industrial supplies n.e.s., up $23m (2%)
- primary industrial supplies n.e.s., up $22m (19%).
Partly offsetting these effects were:
- organic and inorganic chemicals, down $317m (54%)
- iron and steel, down $79m (21%).
In original terms, intermediate and other merchandise goods fell $326m (5%) to $6,360m.
OTHER GOODS
The trend estimate of imports of other goods fell $11m (2%) to $588m.
In both original and seasonally adjusted terms, other goods imports rose $35m (7%) to $529m.
The main component contributing to the rise in the estimates was goods for processing, up $90m, partly offset by non-monetary gold, down $55m (17%).
Imports of services
SERVICES DEBITS
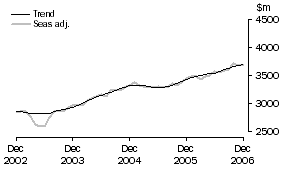
In trend terms, services debits rose $17m to $3,701m.
Seasonally adjusted, services debits rose $8m to $3,690m.
The main components that contributed to the rise in the seasonally adjusted estimates were:
- travel services, up $16m (1%)
- other services, up $5m.
Partly offsetting these effects was transportation services, down $15m (1%).
Seasonally adjusted, tourism related services debits rose $56m (3%) to $1,973m.
 Print Page
 Print All