NOTES
ABOUT THIS PUBLICATION
This publication presents national statistics on prisoners who were in custody on 30 June 2005. These statistics describe the characteristics of prisoners, sentence lengths, and offences for which offenders are imprisoned, and provide a basis for measuring change over time.
FURTHER INFORMATION
More information about ABS activities in the field of crime and justice statistics is available from the Crime and Justice theme page on the ABS website <www.abs.gov.au>. Details of other ABS publications relating to Crime and Justice statistics can be found in paragraphs 76-77 of the Explanatory Notes.
ACKNOWLEDGEMENTS
The ABS acknowledges the valuable contribution of the Board of Management and Advisory Group of the National Corrective Services Statistics Unit and the staff of the various agencies that provide the statistics that are presented in this publication.
INQUIRIES
For further information about these and related statistics, contact the National Information and Referral Service on 1300 135 070 or Marika Woodberry on Melbourne (03) 9615 7601.
SUMMARY OF FINDINGS
INTRODUCTION
This publication presents information from the National Prisoner Census about persons held in Australian prisons on the night of 30 June 2005. The National Prisoner Census covers all prisoners in the legal custody of adult corrective services in adult prisons, including periodic detainees in New South Wales and the Australian Capital Territory, but excluding persons held in juvenile institutions, psychiatric custody and police custody. It is based on data extracted from administrative records held by the corrective services agencies in each Australian state and territory. These statistics provide a profile of the legal status and sentence details as well as demographic characteristics of Australian prisoners.
Users of this publication should note that it provides a picture of the persons in prison at a point in time (30 June 2005), and does not represent the flow of prisoners during the year. The majority of prisoners in the annual Prisoner Census were serving long-term sentences for serious offences, whereas the flow of offenders in and out of prisons consists primarily of persons serving short sentences for lesser offences. Complementary information to this publication about Australian prisoners is available in the Australian Bureau of Statistics (ABS) quarterly publication, Corrective Services, Australia (cat. no. 4512.0).
The Explanatory Notes provide detailed information on the data sources, definitions, counting rules and other technical matters associated with this publication.
For ease of reading, 'most serious offence/charge' may be referred to as 'offence/charge' throughout this publication.
PRISONER SNAPSHOT
At 30 June 2005 there were 25,353 prisoners (sentenced and unsentenced) in Australian prisons, an increase of 5% (1,182 prisoners) since 30 June 2004. This represented an imprisonment rate of 163 prisoners per 100,000 adult population.
Unsentenced prisoners comprised 20% (5,133) of the total prisoner population. Most (60% or 15,308) prisoners had served a sentence in an adult prison prior to the current episode. The offence/charge of acts intended to cause injury accounted for the highest proportion (17% or 4,334) of all prisoners.
Of the total prisoner population, 7% (1,734) were female and 22% (5,656) were Indigenous. The median age of all prisoners was 32 years.
New South Wales held the largest number of prisoners (39% or 9,819), followed by Queensland (21% or 5,354), Victoria (15% or 3,692) and Western Australia (14% or 3,482).
Changes in the prisoner population
The total prisoner population increased by 5% from 24,171 on 30 June 2004 to 25,353 on 30 June 2005. From 1995 the prisoner population increased by 45%.
CHANGE IN PRISONER NUMBERS BETWEEN 30 JUNE 2004 AND 30 JUNE 2005
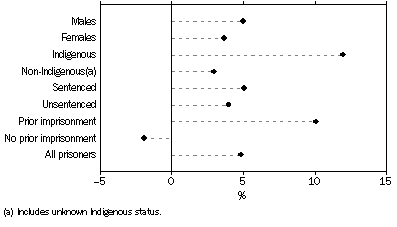
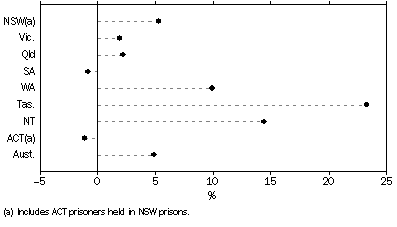
Between 2004 and 2005, there was an increase in the number of prisoners in all states and territories except South Australia and the Australian Capital Territory. Tasmania had the highest proportionate increase (23%) followed by Northern Territory (14%) and Western Australia (10%). South Australia and the Australian Capital Territory both declined by 1%.
CHANGE IN PRISONER NUMBERS BETWEEN 30 JUNE 2004 AND 30 JUNE 2005, states and territories
Imprisonment rates
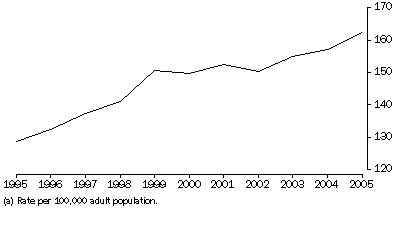
At 30 June 2005, the Australian imprisonment rate was 163 prisoners per 100,000 adult population, representing an increase of 3% on the rate of 157 prisoners per 100,000 adult population in 2004. Most states and territories recorded an increase in imprisonment rates between 2004 and 2005. The largest imprisonment rate increases were in Tasmania (22%), the Northern Territory (12%), and Western Australia (8%). The Australian Capital Territory, South Australia and Queensland recorded decreases in imprisonment rates (each 2% or less).
IMPRISONMENT RATES(a)
Indigenous prisoners
The number of Indigenous prisoners increased by 12%, from 5,048 at 30 June 2004 to 5,656 at 30 June 2005, the largest annual increase since 1999. Indigenous prisoners represented 22% of the total prisoner population at 30 June 2005, the highest end of June proportion since 1995. Northern Territory and Tasmania had the highest (both 19%) proportional increases in their Indigenous prisoner population over the year, rising from 556 at 30 June 2004 to 663 at 30 June 2005 for Northern Territory and 59 to 70 for the same period for Tasmania. Victoria followed with an 18% increase, rising from 186 prisoners to 220.
The proportion of prisoners that were Indigenous was variable across states and territories. In the Northern Territory 81% of the prisoner population was Indigenous while Victoria had the lowest proportion (6%).
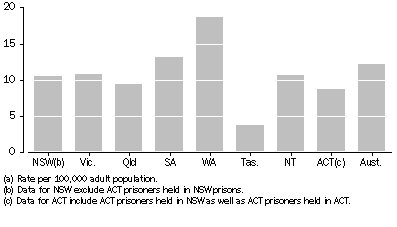
When comparing rates of imprisonment for Indigenous and non-Indigenous prisoners, it is recommended that age standardised rates be used. (For further explanation refer to Explanatory Notes, paragraphs 21-26.) The age standardised rate of imprisonment for Indigenous prisoners was 1,561 per 100,000 adult Indigenous population, making Indigenous persons 12 times more likely than non-Indigenous persons to be in prison at 30 June 2005.
Western Australia and South Australia recorded the highest age standardised ratios of Indigenous to non-Indigenous rates of imprisonment, with Indigenous persons being 19 and 13 times respectively more likely to be in prison. Tasmania had the lowest age standardised ratio of Indigenous to non-Indigenous rates of imprisonment, with Indigenous persons being 4 times more likely to be in prison.
RATIO OF INDIGENOUS TO NON-INDIGENOUS AGE STANDARDISED RATES OF IMPRISONMENT(a)
MOST SERIOUS OFFENCE/CHARGE
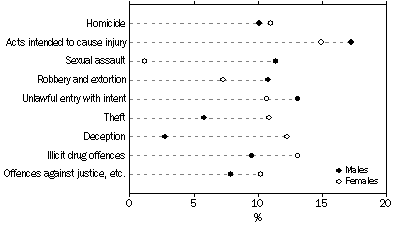
A most serious offence/charge is determined for each prisoner (see paragraphs 58-60 of the Explanatory Notes). At 30 June 2005, the most prevalent offences/charges for prisoners (either sentenced or unsentenced) were: acts intended to cause injury (17%); unlawful entry with intent (13%); sexual assault and related offences (11%); robbery, extortion and related offences (11%); homicide and related offences (10%); and illicit drug offences (10%).
Similar proportions of males and females were in prison for an offence/charge of homicide and related offences (10% of males, 11% of females) and acts intended to cause injury (17% of males, 15% of females). Other offences varied between males and females, with males more likely to be in prison for sexual assault and related offences than females (11% of males, 1% of females), and robbery, extortion and related offences (11% of males, 7% of females). Females were more likely than males to be in prison for deception and related offences (12% of females, 3% of males), theft and related offences (11% of females, 6% of males), and illicit drug offences (13% of females, 10% of males).
SELECTED MOST SERIOUS OFFENCE/CHARGE, by sex
AGE AND SEX
Males dominated the prisoner population comprising 93% (23,619) of the total, whilst females comprised 7% (1,734). The number of male prisoners increased by 5% (1,120) from 30 June 2004, whilst the number of female prisoners increased by 4% (62) for this same period. Over the last 10 years the number of female prisoners generally increased at a greater rate than males.
CHANGE IN PRISONER NUMBERS BETWEEN 30 JUNE 1995 AND 30 JUNE 2005

The imprisonment rate for males was 307 prisoners per 100,000 adult male population, while for females it was 22 prisoners per 100,000 adult female population.
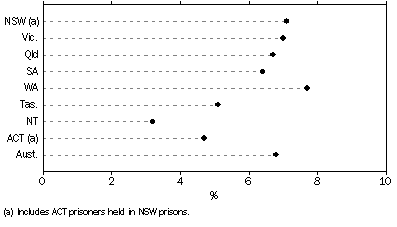
Western Australia had the highest proportion of female prisoners (8% or 268 female prisoners), whilst the lowest proportion was in the Northern Territory (3% or 26 female prisoners).
PROPORTION OF FEMALE PRISONERS, states and territories
The median age of all prisoners in Australian prisons at 30 June 2005 was 32 years. The majority (71%) of prisoners were aged between 20 and 39. Prisoners aged between 25 and 34 comprised 39% of the total.
Prisoners with an offence/charge of sexual assault and related offences had the highest median age (41 years), while robbery, extortion and related offences had the lowest (28 years).
Indigenous prisoners
The majority (79%) of Indigenous prisoners were aged between 20 to 39, while just over two thirds (68%) of the non-Indigenous population were in this age group. The median age of Indigenous and non-Indigenous prisoners differed (30 years and 33 years respectively).
PRIOR IMPRISONMENT
The majority (60%) of prisoners in custody at 30 June 2005 had served a sentence in an adult prison prior to the current episode.
PRIOR IMPRISONMENT(a), by selected most serious offence/charge

The offence/charge of offences against justice procedures, government security and operations had the highest proportion (81%) of prisoners with prior imprisonment, followed by unlawful entry with intent (78%). Illicit drug offences had the lowest (39%) rate of prisoners with prior imprisonment.
The proportion of prisoners with prior imprisonment for all states and territories was over 50%, ranging from 52% in Victoria to 72% in the Australian Capital Territory.
SENTENCED PRISONERS
There were 20,220 sentenced prisoners in Australian prisons at 30 June 2005, an increase of 5% since 2004 (19,236).
Most serious offence
Six offences accounted for over 70% of sentenced prisoners: acts intended to cause injury (15%); unlawful entry with intent (13%); sexual assault and related offences (12%); robbery, extortion and related offences (11%); homicide and related offences (10%); and illicit drug and related offences (10%).
The proportion of sentenced prisoners with an offence of acts intended to cause injury increased from 11% in 2000 to 15% in 2005. The proportion of prisoners with an offence of robbery, extortion and related offences decreased over the past 4 years (from 14% in 2002 to 11% in 2005).
Most serious offence - Indigenous prisoners
Just under a third (29%) of all Indigenous prisoners were sentenced for acts intended to cause injury. This offence accounted for 11% of all non-Indigenous sentenced prisoners. Indigenous sentenced prisoners comprised 3% of the total number of sentenced prisoners with an offence of illicit drugs.
Prisoners sentenced in the last 12 months
Over half (51% or 10,367) of all sentenced prisoners were sentenced in the 12 months preceding 30 June 2005.
Prisoners sentenced in the last 12 months were most likely to be serving a sentence for acts intended to cause injury (19%); offences against justice, government security and operations (15%); unlawful entry with intent (13%) or road traffic and motor vehicle regulatory offences (11%). Offences differed significantly for those prisoners that were sentenced more than 12 months ago: homicide and related offences accounted for 19%; sexual assault and related offences 17%; and robbery, extortion and related offences 17%.
Of those prisoners sentenced in the last 12 months, 67% had served a sentence in an adult prison prior to the current episode being served, while 56% of prisoners sentenced more than 12 months ago and 56% of unsentenced prisoners had prior imprisonment.
Sentence lengths - aggregate sentence length
Of all sentenced prisoners, 5% were serving a life or another indeterminate sentence, while a further 5% were serving a sentence of periodic detention. Of the remaining sentenced prisoners, the majority (63%) had an aggregate sentence length of less than 5 years with 38% having an aggregate sentence length of less than 2 years.
Excluding prisoners with indeterminate, life and periodic detention sentences, the median aggregate sentence length for sentenced prisoners was 36 months (3 years). (See paragraphs 54-56 of the Explanatory Notes for information about interpreting mean and median sentence lengths based on a census 'snapshot'). The longest median aggregate sentence lengths were for homicide and related offences (180 months or 15 years), sexual assault and related offences (84 months or 7 years) and robbery, extortion and related offences (72 months or 6 years).
Expected time to serve
Expected time to serve takes into account the earliest date of release for sentenced prisoners. The median expected time to serve for sentenced prisoners at 30 June 2005 was 23 months (1.9 years), a slight decrease from 24 months (2 years) since 30 June 2004. The majority (71%) of prisoners had an expected time to serve of less than 5 years, while 57% of prisoners had an aggregate sentence of less than 5 years. (These figures exclude prisoners with life without a minimum, indeterminate, and periodic detention sentences).
SENTENCED PRISONERS, by median sentence length and selected most serious offence(a)

UNSENTENCED PRISONERS
Unsentenced (remand) prisoners include unconvicted prisoners awaiting a court hearing or trial, convicted prisoners awaiting sentencing and persons awaiting deportation. There were a total of 5,133 unsentenced prisoners in Australian prisons on 30 June 2005, an increase of 4% since 30 June 2004 (4,935). The proportion of unsentenced prisoners to the total prisoner population remains unchanged since 2004 (20%).
Of all states and territories, South Australia had the highest proportion (34%) of unsentenced prisoners. Western Australia and the Northern Territory had lower proportions of unsentenced prisoners than other jurisdictions (16% each).
Most serious charge
Of the unsentenced prisoners, 26% had a most serious charge of acts intended to cause injury, an increase of 3% since 2004. This was followed by unlawful entry with intent (14%), a decrease of 1% from 2004.
Time on remand
Time on remand is influenced by a number of factors, including the time it takes for a case to come before a court, and eligibility and availability of bail. The median number of months spent on remand by unsentenced prisoners in custody at 30 June 2005 was 2.8 months. (See paragraphs 54-56 of the Explanatory Notes for information about interpreting median time on remand based on a census 'snapshot'). The longest amount of time spent on remand was by prisoners charged with homicide and related offences (median of 7.6 months), followed by abduction and related offences (median of 5.2 months).
Indigenous unsentenced prisoners
Indigenous unsentenced prisoners were more likely to be on remand for acts intended to cause injury (45%) than non-Indigenous unsentenced prisoners (21%). Indigenous unsentenced prisoners were less likely to be on remand for charges of homicide and related offences (7% of Indigenous remandees, 11% of non-Indigenous remandees) and illicit drug offences (2% of Indigenous remandees, 10% non-Indigenous remandees).
The median time spent on remand by Indigenous prisoners at 30 June 2005 was 1.9 months, less than that spent on remand by non-Indigenous prisoners (3.1 months). The median time on remand by Indigenous prisoners was less than non-Indigenous prisoners for almost all charge types except sexual assault and related offences and robbery, extortion and related offences, where the median time on remand was the same for Indigenous and non-Indigenous prisoners (4 months and 3.6 months respectively).
PERIODIC DETAINEES
The sentencing option of periodic detention, where detainees are in custody for two consecutive days in a week and remain at liberty the rest of the week, is available only in New South Wales and the Australian Capital Territory. There were 953 periodic detainees at 30 June 2005, an increase of 15% or 123 prisoners since 2004. Most of this increase is due to increases in periodic detainees for road traffic and motor vehicle regulatory offences (from 212 in 2004 to 297 in 2005) and deception and related offences (from 65 in 2004 to 96 in 2005).
 Print Page
 Print All