NOTES
INQUIRIES
For further information about these and related statistics, contact the National Information and Referral Service on 1300 135 070 or Michael Vardon on Canberra (02) 6252 7348.
ACKNOWLEDGEMENT
The ABS is indebted to the many people and organisations that provided data for inclusion in this publication, and to those who refereed the draft tables and manuscript. The ABS acknowledges the important contributions from federal, State, Territory and local government agencies, water authorities and a range of private sector organisations. Without these contributions, this publication would not have been possible. The Water Account was partly funded by the National Water Commission and forms parts of the Australian Water Resources 2005 (AWR 2005) project <www.water.gov.au>.
SUMMARY COMMENTARY
INTRODUCTION
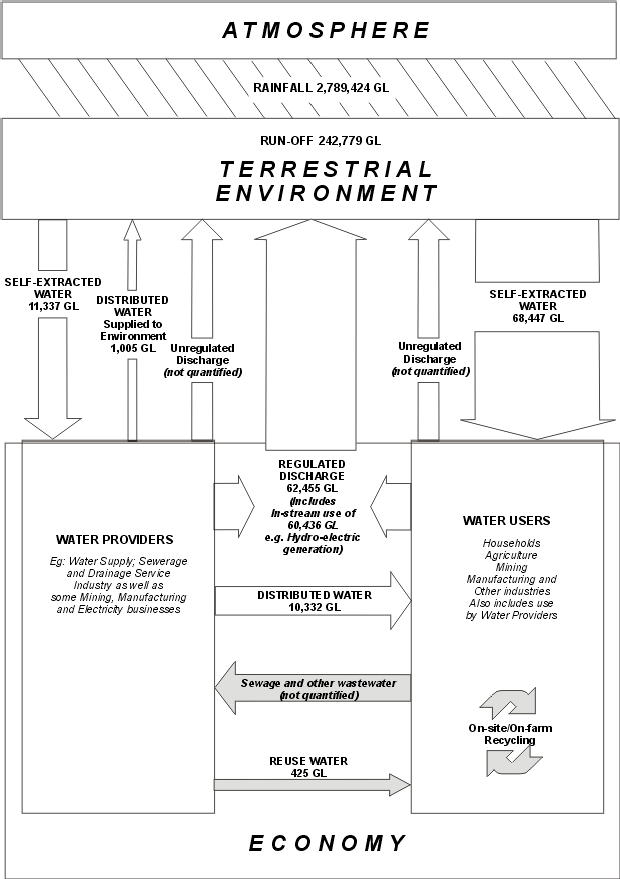
Water Account, Australia presents information on the supply and use of water in the Australian economy in 2004-05, compiled in accordance with the System of Integrated Environmental and Economic Accounting (UN 2003a). Figure 1.1 shows the flows of water within and between the economy and the environment and is useful for understanding the scope of the Water Account as well as providing an overview of key data. Additional data on other aspects of water use by particular industries (e.g. the agriculture and water supply, sewerage and drainage services industries) are presented in successive sections.
Environmental and economic accounting is an evolving field of statistics. Since the publication of the first two editions of the Water Account, advances have been made in the theory and practice of water accounting nationally and overseas. In addition, Australia's governments have developed and begun implementing the Intergovernmental Agreement on a National Water Initiative (NWI; COAG 2004). The NWI, which builds on the 1994 COAG agreement on reforming the Australian water industry, specifically mentions water resource accounting and calls for the annual compilation of water accounts. While the exact nature of these accounts is still being determined, it is apparent that the Water Accounts presented here are consistent with those envisaged in the NWI (see SKM 2006).
SEEA 2003
Internationally, the United Nations (UN) has published a draft handbook on the System of Environmental and Economic Accounting for Water (SEEAW) (UN 2006). Australia was a leading contributor to the development of SEEAW, which builds on the SEEA 2003 (UN 2003a). SEEAW has strengthened the conceptual foundations of the Water Accounts as well as providing guidance on the practical compilation of accounts.
Water Consumption and Water Use
Calculating water use by industries is not straightforward. Water use can include self-extracted water, distributed water, or reuse water, and sometimes a combination of all three sources are used. Calculating water use estimates for an industry or business is made more complicated when water is also supplied to other users, or when water is used in-stream. As such, simply adding self-extracted water, distributed water, and reuse water to derive a figure for total water use can be misleading.
In the Water Account, volumes of water used and supplied by each industry have been balanced to derive 'water consumption'. This figure takes into account the different characteristics of water supply and use of industries and is a way of standardising water use, allowing for comparisons between industries. As such, the following accounting identities have been used:
Total water use is equal to the sum of Distributed water use, Self-extracted water use and Reuse water use;
Water consumption is equal to the sum of Distributed water use, Self-extracted water use and Reuse water use less Water supplied to other users less In-stream use and less Distributed water use by the environment.
For most industries, water use and water consumption are the same as most industries do not have any in-stream use or supply water to other users. However water consumption will be considerably different for some industries, specifically the water supply, sewerage and drainage services industry, electricity and gas supply industry, mining industry, and manufacturing industry where in-stream water use and water supply volumes are significant.
1.1 Water supply and use in the Australian economy - 2004-05
Climate
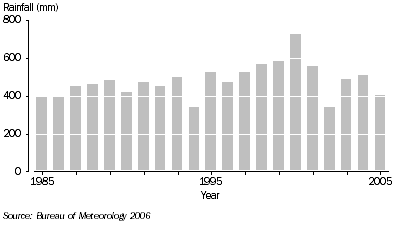
Water supply and use in the Australian economy needs to be viewed in the context of Australia's climate. Annual rainfall variability is greater for Australia than any other continental region (Smith 1998). In particular, rainfall in the years preceding the Water Account reference periods (i.e. 2000-01 and 2004-05) is important as this plays a large part in determining the amount of water available in the environment as surface and groundwater as well as in dams and other water storages.
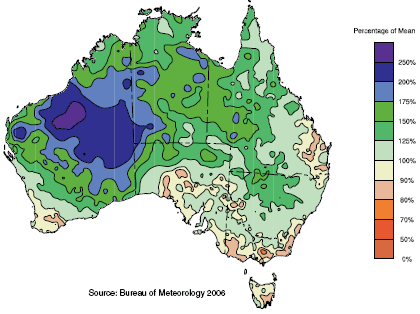
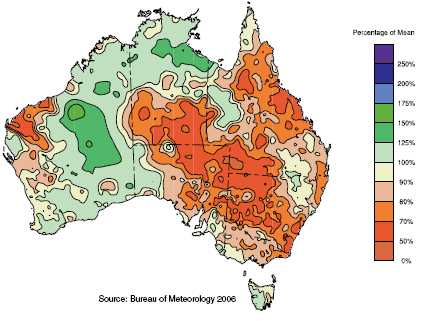
Graph 1.2 shows a peak in rainfall in 2000 followed by a trough in 2002. Many parts of Australia experienced below average rainfall in 2004-05, with drought conditions existing in some areas. Consequences of this included urban water restrictions and reduced availability of water for irrigators. Maps 1.3 and 1.4 also highlight the spatial differences in rainfall patterns in 2001 compared to 2005.
1.2 Annual rainfall - 1985 to 2005
1.3 Percentage of mean annual rainfall, 1998-99 to 2000-01
 1.4 Percentage of mean annual rainfall, 2002-03 to 2004-05
Data Quality and Comparability
The Water Account has drawn on data from a large number of sources. It made use of surveys conducted by the ABS and others, as well as publicly available information found on websites, research papers, annual reports, etc. There are nearly 100 references in the Bibliography, providing an indication of the breadth of information used to compile the Water Account. The data sources were of varying quality and the Explanatory Notes provide information on the degree of confidence, in qualitative terms, that can be placed in the estimates.
There have been a number of improvements in the data used to compile the 2004-05 Water Account. In particular, more data were sourced from ABS surveys in this edition of the Water Account than previous editions. This, together with increased cooperation and assistance from State, Territory and Australian government agencies as well as with the water providers, has led to substantial improvements in the quality of data. Revisions have also been made to the data for 2000-01. This allows for greater comparability between the 2000-01 and 2004-05 Water Accounts.
While every care has been taken to ensure consistency between 2000-01 and 2004-05, the changes between the reference periods need to be interpreted cautiously owing to differences in climate, data sources, data availability and data quality. Extreme care should be taken when making comparisons to the data included in the first Water Account in respect of the years 1993-94 to 1996-97 with the data for 2004-05 and 2000-01.
MAIN FINDINGS
Main findings include:
- During 2004-05, 79,784 GL of water was extracted from the environment and used within the Australia economy. Of this amount, 11,337 GL was extracted by water providers, while water users directly extracted 68,447 GL.
- Of the total volume extracted from the environment (79,784 GL), 62,445 GL was returned to the environment as regulated discharge, with 60,436 GL of this discharge being in-stream use, almost entirely by the electricity and gas supply industry (59,924 GL) for hydro-electric power generation.
- In 2004-05, there were 413 water providers in Australia, supplying 11,337 GL of distributed water. This compares to 479 providers and 12,934 GL in 2000-01.
- Water consumption was 18,767 GL in 2004-05, a decrease of 14% from 2000-01 when it was 21,703 GL.
- The agriculture industry consumed the largest volume of water with 12,191 GL, representing 65% of water consumption in Australia in 2004-05. This is a decrease from 2000-01 when it was 14,989 GL and 69% of water consumption.
- Water consumption by Households was 2,108 GL in 2004-05, accounting for 11% of water consumption in Australia. This compares with 2,278 GL in 2000-01 when it accounted for 10% of water consumption.
- In 2004-05, Australia's large dams had a capacity of 83,853 GL. They contained 39,959 GL of water at 30 June 2005, a decline of 10% from 30 June 2004 when they contained 44,164 GL.
- The 1,300 GL traded in 2004-05 represented 7% of water consumption and 4% of the entitlement volume of water access entitlements.
Tables 1.5 and 1.6 summarise much of the data contained in the Water Account.
1.5 Water account summary table, 2000-01 and 2004-05 |
|  |
 | Australia | 2004-05 |  |
 | 2000-01 | 2004-05 | NSW | Vic. | Qld | SA | WA | Tas. | NT | ACT |  |
|  |
| Rainfall (GL) | na | 2 789 424 | 406 562 | 146 928 | 865 973 | 147 773 | 639 609 | 75 189 | 505 623 | 1 767 |  |
| Run-off (GL)(a) | 385 924 | 242 779 | 30 266 | 14 266 | 93 018 | 1 285 | 24 560 | 32 084 | 47 151 | 149 |  |
| Water extracted from environment (GL) | 76 668 | 79 784 | 16 528 | 11 213 | 7 964 | 1 352 | 3 417 | 39 081 | 145 | 84 |  |
| Water consumption (GL) | 21 703 | 18 767 | 5 922 | 4 993 | 4 361 | 1 365 | 1 495 | 434 | 141 | 56 |  |
| Capacity of large dams (GL)(c) | 83 312 | 83 853 | 24 629 | 12 109 | 10 657 | 258 | 12 148 | 23 652 | 280 | 120 |  |
| Volume in large dams (GL)(d) | na | 39 959 | 8 200 | 4 729 | 5 309 | 116 | 10 135 | 11 191 | 196 | 82 |  |
| Entitlements (GL) | na | 29 831 | 13 302 | 6 680 | 4 397 | 1 661 | 2 547 | 1 038 | 140 | 66 |  |
| Allocations (GL) | na | na | 9 799 | 4 734 | na | 1 661 | 2 547 | 1 038 | 140 | 66 |  |
| Trade (GL)(e)(f) | na | 1 300 | 424 | 502 | 214 | 83 | 71 | 43 | - | - |  |
| Population ('000) | 19 387 | 20 329 | 6 774 | 5 022 | 3 964 | 1 542 | 2 010 | 485 | 203 | 325 |  |
| Area (000 km2) | 7 673 | 7 673 | 800 | 227 | 1 726 | 983 | 2 522 | 67 | 1 345 | 2 |  |
| Gross State Product ($m)(g) | 752 434 | 838 251 | 290 746 | 212 243 | 144 701 | 56 737 | 92 339 | 14 794 | 9 381 | 17 309 |  |
|  |
| - nil or rounded to zero (including null cells) |
| na not available |
| (a) For 2000-01 this is the Mean Annual Run-off as reported in the Water Resource Assessment 2000 (NLWRA 2001) and the 2000-01 Water Account, Australia. |
(b) Includes water extracted for the purpose of use.
(c) Volume at 30 June and includes 'dead' storage. |
| (d) Volume at 30 June. |
| (e) Temporary and permanent trades. |
| (f) Total for Australia cannot be calculated by taking the sum of the States and Territories as this would double count interstate trades. |
| (g) Chain volume measure. |
1.6 Water consumption, 2000-01 and 2004-05 |
|  |
 | Australia | 2004-05 |  |
 | 2000-01 | 2004-05 | NSW | Vic. | Qld | SA | WA | Tas. | NT | ACT |  |
 | GL | GL | GL | GL | GL | GL | GL | GL | GL | GL |  |
|  |
| Agriculture | 14 989 | 12 191 | 4 133 | 3 281 | 2 916 | 1 020 | 535 | 258 | 47 | 1 |  |
| Forestry and fishing(a) | 44 | 51 | 11 | 8 | 3 | 1 | 25 | 4 | 1 | - |  |
| Mining | 321 | 413 | 63 | 32 | 83 | 19 | 183 | 16 | 17 | - |  |
| Manufacturing | 549 | 589 | 126 | 114 | 158 | 55 | 81 | 49 | 6 | 1 |  |
| Electricity and gas | 255 | 271 | 75 | 99 | 81 | 3 | 13 | - | 1 | - |  |
| Water supply(b)(c) | 2 165 | 2 083 | 631 | 793 | 426 | 71 | 128 | 20 | 8 | 5 |  |
| Other industries | 1 102 | 1 059 | 310 | 262 | 201 | 52 | 168 | 18 | 30 | 17 |  |
| Household | 2 278 | 2 108 | 572 | 405 | 493 | 144 | 362 | 69 | 31 | 31 |  |
| Total | 21 703 | 18 767 | 5 922 | 4 993 | 4 361 | 1 365 | 1 495 | 434 | 141 | 56 |  |
|  |
| - nil or rounded to zero (including null cells) |
| (a) Includes Services to agriculture; hunting and trapping. |
| (b) Includes Sewerage and drainage services. |
| (c) Includes water losses. |
WATER SUPPLY AND USE
This section presents information on the volume of water supplied and used within the Australian economy in 2004-05. Water consumption by the States and Territories is presented, as well as water consumption by main industry groups. The industries are based on the Australian and New Zealand Standard Industrial Classification 1993 (ANZSIC) (ABS and New Zealand Department of Statistics 1993) but have been adapted. For example, agriculture is split by commodity, not by lower level ANZSIC classes.
WATER CONSUMPTION BY INDUSTRY
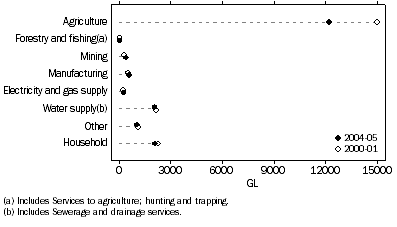
Graph 1.7 shows water consumption, by industry, for Australia in 2004-05 and 2000-01. Water consumption in Australia for 2004-05 was 18,767 GL compared to 21,702 GL in 2000-01. The agriculture industry had the highest water consumption in 2004-05, accounting for 12,191 GL (or 65%), a decrease from 14,989 GL in 2000-01. Households were the next highest consumer of water in 2004-05, accounting for 2,108 GL (or 11%) of water consumption. The water supply, sewerage and drainage services industry was also a significant consumer of water, accounting for 2,083 GL (or 11%) of water consumption (mostly due to losses in distribution), followed by manufacturing with 589 GL (or 3%).
1.7 Water consumption, Australia - 2000-01 and 2004-05
WATER CONSUMPTION BY STATE AND TERRITORY
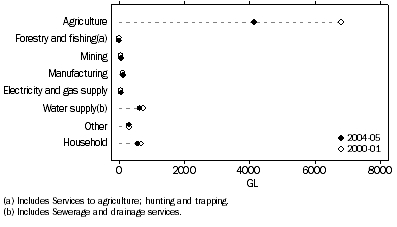
For 2004-05, water providers and users in the Australian Capital Territory have given the ABS consent to publish data which may identify them. However, to allow comparisons with 2000-01 data, New South Wales and the Australian Capital Territory have been amalgamated for Graph 1.8.
New South Wales and Australian Capital Territory
In New South Wales and the Australian Capital Territory combined, water consumption was 5,978 GL during 2004-05 compared to 8,783 GL in 2000-01. In 2004-05, the highest consumer was the agriculture industry with 4,134 GL or 69% of water consumption. This was followed by the water supply, sewerage and drainage services industry which consumed 637 GL or 11% of water.
1.8 Water consumption, New South Wales and Australian Capital Territory - 2000-01 and 2004-05
Victoria
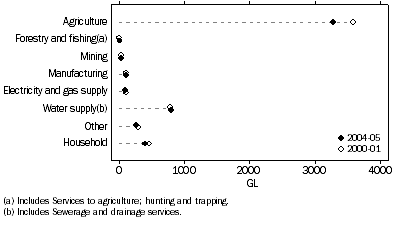
In Victoria, 4,993 GL of water was consumed in 2004-05 compared to 5,375 GL in 2000-01. The agriculture industry was the highest consumer of water in Victoria in 2004-05 (Graph 1.9), with 3,281 GL (or 66%) of Victoria's water consumption. Dairy farming was the main consumer within the agriculture industry, with 1,710 GL (or 52% of Agricultural water consumption in Victoria). The water supply, sewerage and drainage services industry was the next highest consumer of water, accounting for 793 GL (or 16%). Households were also a significant consumer of water with 405 GL or 8% of Victoria's water consumption.
1.9 Water consumption, Victoria - 2000-01 and 2004-05
Queensland
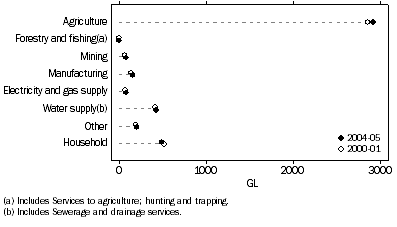
In Queensland, 4,361 GL of water was consumed in 2004-05 compared to 4,267 GL in 2000-01. The agriculture industry consumed the most water in 2004-05 with 2,916GL or 67% of Queensland's water consumption. Sugar and Cotton were the main consumers within the agriculture industry, with 1,116 GL and 857 GL consumed respectively. The next largest consumers were Households, with 493 GL or 11% of Queensland's water consumption (Graph 1.10).
1.10 Water consumption, Queensland - 2000-01 and 2004-05
South Australia
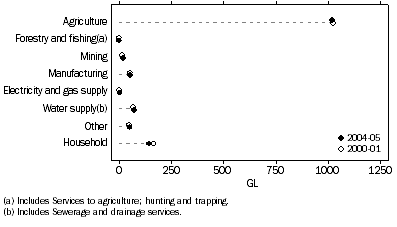
Water consumption in South Australia was 1,365 GL in 2004-05 compared to 1,383 GL in 2000-01. The agriculture industry was the largest consumer of water in 2004-05, accounting for 1,020 GL or 75% of South Australia's water consumption. Livestock, pasture, grains and other agriculture had the highest water consumption within the agriculture industry with 483 GL (or 47%) followed by Grapes with 204 GL (or 20%). Households were also large consumers of water with 144 GL or 11% of South Australia's water consumption (Graph 1.11).
1.11 Water consumption, South Australia - 2000-01 and 2004-05
Western Australia
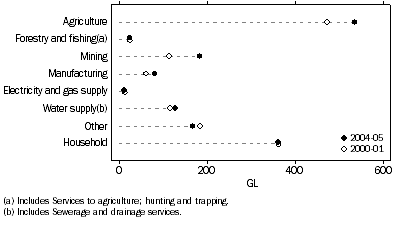
In Western Australia, 1,495 GL of water was consumed in 2004-05 compared to 1,353 GL in 2000-01. In 2004-05, the agriculture industry consumed the largest volume (535 GL or 36%) followed by Households (362 GL or 24%) (Graph 1.12). Consumption by the mining industry was also substantial (183 GL or 12%).
1.12 Water consumption, Western Australia - 2000-01 and 2004-05
Tasmania
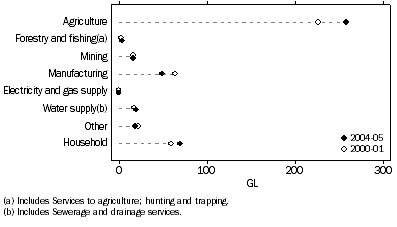
Water consumption was 434 GL in Tasmania in 2004-05 compared to 408 GL in 2000-01. In 2004-05, the agriculture industry was the largest consumer accounting for 258 GL or 59% of water consumption in the State (Graph 1.13). Households were also a major consumer of water in Tasmania, with 69 GL or 16%. The manufacturing industry consumed 49 GL or 11%. Most of the water consumed by the manufacturing industry in Tasmania, was by the wood and paper products industry (71% of water consumption by the manufacturing industry in Tasmania).
1.13 Water consumption, Tasmania - 2000-01 and 2004-05
Northern Territory
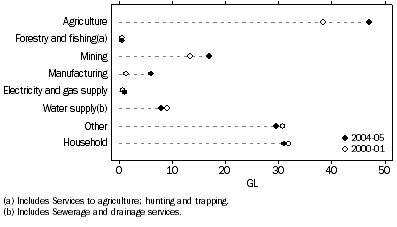
In the Northern Territory, 141 GL of water was consumed in 2004-05 compared to 134 GL in 2000-01. In 2004-05, the agriculture industry accounted for 47 GL (or 33%) (Graph 1.14). The next highest consumer of water was households, consuming 31 GL (or 22%).
1.14 Water consumption, Northern Territory - 2000-01 and 2004-05
WATER SUPPLY, SEWERAGE AND DRAINAGE
This section presents information on the water supply, sewerage and drainage services industry (here after shortened to the water supply industry) as well as on the supply of distributed and reuse water in Australia for 2004-05.
DISTRIBUTED WATER
In 2004-05, water providers in Australia supplied 11,337 GL of distributed water. The quantity of distributed water supplied decreased 12% between 2000-01 and 2004-05. This was mostly due to a decrease of 1,704 GL or 24% in agriculture (Table 1.15). Significant periods of below average rainfall and drought have occurred over this time, causing a reduction in allocations to Irrigation/rural water providers, therefore reducing the quantity of water available for supply to customers.
1.15 Use of distributed water, by industry - 2000-01 and 2004-05 |
|  |
 |  | NSW(a) | Vic. | Qld | SA | WA | Tas. | NT | ACT(a) | Australia |  |
 |  | ML | ML | ML | ML | ML | ML | ML | ML | ML |  |
|  |
| 2004-05 |  |  |  |  |  |  |  |  |  |  |
 | Agriculture | 1 584 192 | 2 228 353 | 1 044 275 | 194 820 | 262 698 | 14 674 | - | - | 5 329 012 |  |
 | Forestry and fishing(b) | 6 446 | 721 | 302 | 29 | 15 444 | 1 408 | 91 | 33 | 24 474 |  |
 | Mining | 6 586 | 3 742 | 42 015 | 756 | 15 783 | 24 | 3 297 | - | 72 203 |  |
 | Manufacturing | 103 971 | 102 769 | 69 303 | 23 960 | 28 343 | 11 617 | 724 | 621 | 341 308 |  |
 | Electricity and gas supply | 7 839 | 21 759 | 77 459 | 1 036 | 6 511 | 102 | 14 | - | 114 720 |  |
 | Water supply(c)(d) | 621 052 | 777 848 | 419 673 | 71 331 | 125 212 | 17 666 | 8 026 | 3 720 | 2 044 529 |  |
 | Other industries(e) | 139 314 | 105 779 | 157 008 | 26 232 | 56 107 | 7 989 | 27 441 | 11 549 | 531 419 |  |
 | Household | 545 423 | 388 991 | 457 916 | 142 279 | 226 151 | 56 905 | 25 396 | 30 989 | 1 874 050 |  |
 | Environment | 96 990 | 373 929 | 383 606 | 713 | 18 | 118 718 | 1 103 | 30 200 | 1 005 277 |  |
 | Total | 3 111 812 | 4 003 891 | 2 651 558 | 461 157 | 736 268 | 229 102 | 66 091 | 77 112 | 11 336 992 |  |
| 2000-01 |  |  |  |  |  |  |  |  |  |  |
 | Agriculture | 2 889 687 | 2 536 996 | 1 106 552 | 221 145 | 264 412 | 14 347 | - | na | 7 033 139 |  |
 | Forestry and fishing(b) | 1 274 | 793 | 3 034 | 557 | 19 846 | 2 749 | 45 | na | 28 298 |  |
 | Mining | 7 288 | 4 620 | 33 056 | 719 | 14 431 | 26 | - | na | 63 194 |  |
 | Manufacturing | 93 724 | 101 399 | 69 159 | 25 048 | 23 955 | 14 097 | 3 054 | na | 327 927 |  |
 | Electricity and gas supply | 9 550 | 20 687 | 72 601 | 813 | 1 791 | 36 | 546 | na | 105 478 |  |
 | Water supply(c)(d) | 740 876 | 778 759 | 412 722 | 67 897 | 116 318 | 16 534 | - | na | 2 142 137 |  |
 | Other industries(e) | 251 337 | 126 262 | 180 601 | 40 862 | 83 510 | 17 180 | 24 141 | na | 718 286 |  |
 | Household | 637 754 | 445 739 | 495 749 | 159 215 | 240 642 | 53 216 | 9 031 | na | 2 056 455 |  |
 | Environment | 200 528 | 253 172 | 4 462 | 873 | - | 358 | 18 534 | na | 459 393 |  |
 | Total | 4 832 019 | 4 268 425 | 2 377 937 | 517 128 | 764 904 | 118 542 | 55 351 | na | 12 934 306 |  |
|  |
| - nil or rounded to zero (including null cells) |
| na not available |
| (a) NSW and ACT were combined in 2000-01. |
| (b) Includes Services to agriculture; hunting & trapping. |
| (c) Includes Sewerage and drainage services. |
| (d) Includes water losses. |
| (e) Includes mainly Services and Administrative industries. |
Origin of Distributed Water
The origin of the distributed water supplied by the water supply industry is presented in Table 1.16. The majority of the 11,160 GL distributed by the water supply industry originated from inland surface water (10,712 GL or 96%). Groundwater accounted for 448 GL (4%) of the total water extracted in Australia, just over half (229 GL) of which was in Western Australia. Desalination accounted for the remainder.
1.16 Origin of distributed water - 2004-05(a) |
|  |
 | NSW | Vic. | Qld | SA | WA | Tas. | NT | ACT | Australia |  |
 | ML | ML | ML | ML | ML | ML | ML | ML | ML |  |
|  |
| Surface water | 3 012 717 | 3 994 520 | 2 532 418 | 444 240 | 496 838 | 111 882 | 42 182 | 77 112 | 10 711 910 |  |
| Groundwater | 61 130 | 9 326 | 109 116 | 16 854 | 229 461 | 443 | 21 338 | - | 447 668 |  |
| Desalinated water(b) | - | - | 85 | 61 | 85 | - | - | - | 231 |  |
| Total | 3 073 847 | 4 003 846 | 2 641 619 | 461 155 | 726 384 | 112 325 | 63 520 | 77 112 | 11 159 809 |  |
|  |
| - nil or rounded to zero (including null cells) |
| (a) Water supply, sewerage and drainage industry only, excludes water provided by other industries. |
| (b) Includes sea water only. |
REUSE WATER
Reuse water is drainage, waste or storm water that has been used again without being first discharged to the environment. It may have been treated to some extent. Reuse or recycled water is considered an important option for securing water supply into the future (AWA 2005). There is an increasing investment in infrastructure related to the supply of reuse water, and as such there is considerable interest in the volumes of reuse water supplied and used. In addition, water management authorities are interested in whether reuse water is reducing the demand for distributed water or self-extracted water.
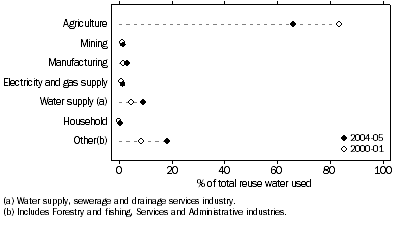
The use of reuse water is presented in Graph 1.17. The agriculture industry used the majority of reuse water (280 GL or 66% of total reuse), followed by other industries, which includes parks, gardens and sporting fields (14%) and the water supply industry (9%). In 2000-01, agriculture also used the majority of reuse water (83%), followed by other industries (8%) and the water supply industry (5%).
1.17 Use of reuse water, Australia - 2000-01 and 2004-05
The use of reuse water supplied by urban water providers is presented in Table 1.18. Major users of urban reuse include agriculture, parks and gardens and the water supply industry.
1.18 Urban use of reuse water - 2004-05(a) |
|  |
 | NSW | Vic. | Qld | SA | WA | Tas. | NT | ACT | Australia |  |
 | ML | ML | ML | ML | ML | ML | ML | ML | ML |  |
|  |
| Agriculture | 19 204 | 25 945 | 10 232 | 18 139 | 54 | 1 846 | 276 | - | 75 696 |  |
| Forestry | 1 639 | 2 860 | 650 | 23 | 3 749 | 28 | 243 | - | 9 192 |  |
| Mining | 5 695 | - | - | - | 26 | - | - | - | 5 721 |  |
| Manufacturing | 410 | 509 | 7 589 | - | 1 887 | - | - | - | 10 395 |  |
| Water supply(b) | 10 080 | 15 370 | 6 418 | - | 2 825 | 1 956 | - | 1 634 | 38 283 |  |
| Households | 1 370 | - | - | - | - | - | - | - | 1 370 |  |
| Parks etc.(c) | 9 756 | 24 295 | 15 669 | 1 484 | 6 621 | 451 | 1 333 | 555 | 60 164 |  |
| Other(d) | 1 594 | 672 | 4 189 | 845 | 101 | 1 | - | - | 7 402 |  |
| Total | 49 748 | 69 651 | 44 747 | 20 491 | 15 263 | 4 282 | 1 852 | 2 189 | 208 223 |  |
|  |
| - nil or rounded to zero (including null cells) |
| (a) Includes reuse supplied or used by Major, Non-major and Minor urban water providers. |
| (b) Includes Sewerage and drainage services. |
| (c) Includes gardens, race tracks, sporting fields. |
| (d) Includes electricity generation, construction, aquaculture, firefighting, education activities. |
WATER SUPPLY INDUSTRY
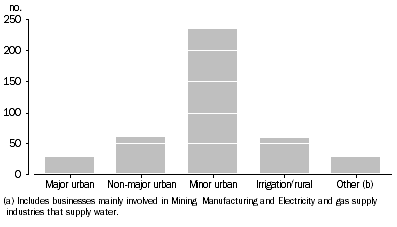
Water providers are generally grouped according to the number of connections or customers served. In general, the provision of water from a water main to a customer meter constitutes a water service connection. Of the 384 water providers in the water supply industry, 235 were Minor urban (less than 10,000 connections), 61 were Non-major urban (between 10,000 and 50,000 connections), 29 were Major urban (greater than 50,000 connections) and 59 were Irrigation/rural (businesses that supply predominantly to agriculture) (Graph 1.19). There were also 29 businesses that supplied water, sewerage and/or drainage services but whose main economic activity was other than supplying water (for example, businesses in the mining, manufacturing, electricity and gas supply industries).
1.19 Number of water providers, by type of water provider - 2004-05
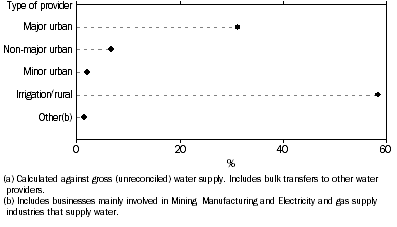
Irrigation/rural water providers were the main suppliers of distributed water in 2004-05 accounting for 6,637 GL or 59% (Graph 1.20) of the total distributed water supply.
1.20 Proportion of distributed water supply(a), by type of water provider - 2004-05
SEWERAGE, DRAINAGE AND REGULATED DISCHARGE
The water discharged from the economy to the environment may be regulated or unregulated. Regulated discharge refers to water discharged after use where that discharge does not match the natural flow regime of the receiving water body. For example, the waste water discharged by sewerage service providers is a regulated discharge. It is likely that drainage water from Irrigation/rural water providers makes a significant contribution to regulated discharge, but this is mostly unmeasured. Currently, the regulated discharge recorded for Irrigation/rural water providers is only 10% of the regulated discharge of the water supply industry.
Of the 1,809 GL discharged by the water supply industry, 68% was discharged to the sea, 31% was discharged to inland surface water, with the remaining 1% discharged to groundwater (Table 1.21).
1.21 Regulated discharge(a), Water supply industry, by receiving body - 2004-05 |
|  |
 | NSW | Vic. | Qld | SA | WA | Tas. | NT | ACT | Australia |  |
 | ML | ML | ML | ML | ML | ML | ML | ML | ML |  |
|  |
| Surface water | 172 960 | 176 768 | 137 548 | 3 137 | 10 141 | 21 491 | 4 023 | 27 293 | 553 361 |  |
| Groundwater | 5 194 | 6 441 | 3 145 | 780 | 7 928 | 7 | - | - | 23 495 |  |
| Sea water | 481 914 | 344 891 | 168 765 | 80 398 | 112 785 | 36 105 | 7 118 | - | 1 231 976 |  |
| Total | 660 068 | 528 100 | 309 458 | 84 315 | 130 854 | 57 603 | 11 141 | 27 293 | 1 808 832 |  |
|  |
| - nil or rounded to zero (including null cells) |
| (a) Includes waste and drainage water discharged. |
AGRICULTURE
This section examines the use of water within the agriculture industry in Australia. Water used by this industry includes stock drinking water and water applied through irrigation to crops and pastures. Water can be directly extracted from the environment by farmers (e.g. from bores, on-farm dams, rivers) or supplied by water providers (e.g. irrigation authorities). The use of rainwater is not included in this section.
To calculate the amount of water used by the agriculture industry, the ABS has used information collected from irrigation authorities, data on water use, irrigated area and livestock numbers from the ABS 2004-05 Agricultural Survey, as well as additional information available from State and Territory agricultural departments and research institutions. Additional detail on the methodology is found in the Explanatory Notes.
Water Consumption
Water consumption by the agriculture industry was 12,191 GL in 2004-05, accounting for 65% of total water consumption in Australia during that period.
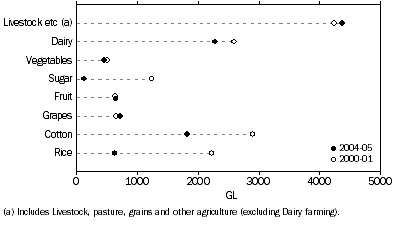
In 2004-05, the Livestock, pasture, grains and other agriculture commodities had the highest water consumption within the agriculture industry, with 4,374 GL (or 36%). This was followed by Dairy farming (2,276 GL or 19%), Cotton (1,822 GL or 15%) and Sugar (1,269 GL or 10%) (Graph 1.22). The largest percentage decreases in water consumption from 2000-01 to 2004-05 were in Rice (72%) and Cotton (37%).
1.22 Total water use, Agriculture, by activity - 2000-01 and 2004-05
Water Source
The majority of the water consumed by the agriculture industry in 2004-05 was self-extracted water (6,582 GL or 54%), with distributed water (5,329 GL or 44%) and reuse water (280 GL or 2%) accounting for the remainder (Table 1.23). The highest self-extracted water use within the agriculture industry in 2004-05 was by Livestock, pasture, grains and other agriculture (2,594 GL) and Cotton (1,697 GL).
1.23 Water consumption, Agriculture, by water type and activity - 2004-05 |
|  |
 |  | Self-extracted | Distributed | Reuse | Total |  |
 |  | ML | ML | ML | ML |  |
|  |
| Dairy farming | 856 993 | 1 339 473 | 79 136 | 2 275 603 |  |
| Vegetables | 307 033 | 132 544 | 15 796 | 455 373 |  |
| Sugar | 404 068 | 858 767 | 6 177 | 1 269 012 |  |
| Fruit | 306 978 | 339 315 | 1 370 | 647 662 |  |
| Grapes | 191 363 | 522 029 | 3 655 | 717 047 |  |
| Cotton | 1 697 245 | 122 071 | 2 194 | 1 821 509 |  |
| Rice | 224 806 | 394 158 | 11 908 | 630 872 |  |
| Livestock, pasture, grains & other |  |  |  |  |  |
 | Livestock | 935 396 | 100 078 | - | 1 035 474 |  |
 | Pasture(a) | 1 000 850 | 887 144 | 39 898 | 1 927 892 |  |
 | Grains | 461 815 | 582 098 | 118 356 | 1 162 268 |  |
 | Other | 195 887 | 51 337 | 1 436 | 248 659 |  |
 | Total | 2 593 948 | 1 620 656 | 159 689 | 4 374 293 |  |
| Total | 6 582 435 | 5 329 012 | 279 925 | 12 191 372 |  |
|  |
| - nil or rounded to zero (including null cells) |
| (a) Excludes pasture for Dairy farming. |
Origin of Water
The majority of self-extracted water use by the agriculture industry in 2004-05 originated from surface water (74%), while groundwater accounted for 23% (Table 1.24).
1.24 Origin of agricultural water - 2004-05 |
|  |
 | Surface water | Groundwater | Other(a) | Total all sources |  |
 | % | % | % | ML |  |
|  |
| NSW(b) | 73 | 25 | 2 | 4 133 768 |  |
| Vic. | 84 | 12 | 4 | 3 281 389 |  |
| Qld | 76 | 23 | 2 | 2 916 138 |  |
| SA | 45 | 46 | 9 | 1 019 841 |  |
| WA | 69 | 26 | 15 | 535 312 |  |
| Tas. | 92 | 6 | 2 | 257 819 |  |
| NT | 18 | 82 | - | 47 105 |  |
| Australia | 74 | 23 | 3 | 12 191 372 |  |
|  |
| - nil or rounded to zero (including null cells) |
| (a) Includes town or country distributed supply, recycled or re-used water from off farm sources and other. |
| (b) Includes the Australian Capital Territory. |
Irrigated Land
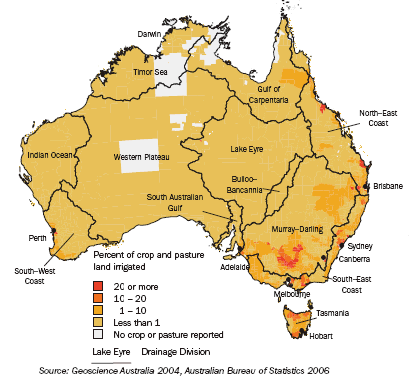
Map 1.25 shows irrigated crops and pastures as a percentage of total land use in Australia, by drainage division. The majority of intensive crop and pasture irrigation occurs in the Murray-Darling drainage division.
1.25 Area irrigated, Australia, by drainage division-2004-05
Value of Irrigated Agricultural Production
Estimating the value of agricultural production that results from irrigation is difficult. This is because water used by crops comes from a variety of sources. In particular, rainwater, which is not included in the Water Account, is usually a component of the water used by irrigated crops, and the timing and location of rainfalls affect the amount of irrigation water required.
In addition, water is not the only input to agricultural production from irrigated land. Land, fertiliser, labour, machinery and other inputs are also used. To separate the contribution that these factors make to total production is practically impossible with current data. Therefore, the estimates of the gross value of irrigated agricultural production presented in Table 1.26 attribute all of the gross value of production from irrigated land to irrigated agricultural production.
The total gross value of irrigated agricultural production in 2004-05 was $9,076 million (Table 1.26) compared to $9,618 million in 2000-01. The decrease in gross value of irrigated production mainly occurred in New South Wales and Australian Capital Territory combined, from $2,371 million in 2000-01 to $1,867 million in 2004-05. Between 2000-01 and 2004-05 there were significant reductions in the value of irrigated production of cotton (from $1,222 million to $908 million) and rice (from $350 million to $102 million).
1.26 Gross value of irrigated agricultural production, 2000-01 and 2004-05 |
|  |
 | Australia | 2004-05 |  |
 | 2000-01 | 2004-05 | NSW | Vic. | Qld | SA | WA | Tas. | NT | ACT |  |
 | $m | $m | $m | $m | $m | $m | $m | $m | $m | $m |  |
|  |
| Dairy farming | 1 499 | 1 632 | 204 | 1 090 | 108 | 88 | 71 | 70 | - | - |  |
| Vegetables | 1 817 | 1 761 | 207 | 411 | 561 | 266 | 165 | 147 | 4 | - |  |
| Sugar | 284 | 477 | 1 | - | 471 | - | 5 | - | - | - |  |
| Fruit | 1 590 | 1 777 | 296 | 524 | 494 | 263 | 118 | 49 | 32 | - |  |
| Grapes | 1 355 | 1 314 | 252 | 336 | 16 | 600 | 89 | 12 | 8 | 1 |  |
| Cotton | 1 222 | 908 | 513 | - | 395 | - | - | - | - | - |  |
| Rice | 350 | 102 | 100 | 1 | - | - | - | - | - | - |  |
| Nurseries, cut flowers & turf | 763 | 737 | 160 | 244 | 173 | 44 | 95 | 14 | 4 | 3 |  |
| Livestock, pasture, grains & other | 737 | 367 | 130 | 71 | 129 | 22 | 3 | 12 | - | - |  |
| Total | 9 618 | 9 076 | 1 864 | 2 677 | 2 349 | 1 284 | 545 | 304 | 49 | 3 |  |
|  |
| - nil or rounded to zero (including null cells) |
MINING AND MANUFACTURING
This section presents data on water use in the mining and manufacturing industries. These industries use water for cleaning, cooling, product movement, dust suppression and as a raw material. The mining and manufacturing industries use water from both distributed supply and self-extracted sources. In addition, there is a growing use of reuse water in both of these industries.
MINING
Water Use
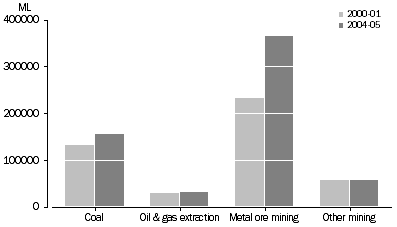
Total water use in the Mining industry was 608,575 ML in 2004-05, a 34% increase from 2000-01 when it was 452,468 ML. In 2004-05 the metal ore mining industry had the highest total water use within the mining industry (364,998 ML), followed by coal mining (154,972 ML) (Graph 1.27). In Western Australia, there was an 81% increase in total water use by the Mining industry between 2000-01 and 2004-05, primarily in the metal ore mining industry.
1.27 Water use, Mining, by industry - 2000-01 and 2004-05
MANUFACTURING
The manufacturing industry consists of nine subdivisions. Water use varies considerably between these subdivisions due to the different nature of the products manufactured.
Water Use
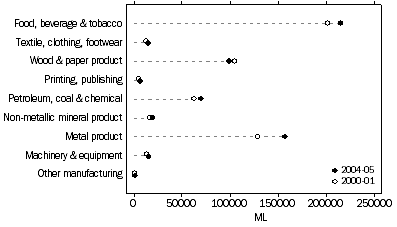
Total water use in the manufacturing industry was 600,505 ML in 2004-05, a 9% increase from 2000-01 when it was 548,887 ML. In 2004-05, the food, beverage and tobacco industry had the highest water use within the manufacturing industry (215,029 ML), followed by the metal products (157,370 ML), wood and paper products (99,238 ML), and petroleum, coal, chemical and associated products (70,324 ML) industries (Graph 1.28).
1.28 Water use, Manufacturing, by industry - 2000-01 and 2004-05
ELECTRICITY GENERATORS
Electricity generators are a significant user of water. Most of the water is used for hydro-electricity power generation, but coal-fired power stations also use considerable amounts of water in their boilers and cooling towers. Water used for hydro-electricity power generation is not a consumptive use as the water extracted passes through turbines to generate electricity and is discharged and made available to downstream users. Therefore water use for hydro-electricity power generation is treated differently from other water uses and is called in-stream use. Water consumption by electricity generation is largely due to evaporation from cooling towers.
Water Use
Total water use by electricity generators was 60,292 GL, a 10% increase since 2000-01 (54,787 GL) (Table 1.29). This volume excludes sea water which is important to the operations of some businesses in this industry - only freshwater is in scope for the supply and use tables (see Explanatory Notes). Self-extracted water accounted for practically all total water use (60,172 GL or 99.8%) by electricity generators in 2004-05.
1.29 Water use and water consumption, electricity generators - 2000-01 and 2004-05 |
|  |
 |  | NSW | Vic. | Qld | SA | WA | Tas. | NT | ACT | Australia |  |
 |  | ML | ML | ML | ML | ML | ML | ML | ML | ML |  |
|  |
| 2004-05 |  |  |  |  |  |  |  |  |  |  |
 | Self-extracted | 10 781 364 | 6 051 163 | 3 217 027 | 285 | 1 841 998 | 38 278 873 | 1 124 | - | 60 171 834 |  |
 | Distributed | 7 764 | 21 714 | 77 459 | 1 011 | 6 476 | 97 | 14 | - | 114 535 |  |
 | Reuse | 1 318 | - | 3 361 | 1 223 | 100 | - | - | - | 6 002 |  |
 | Total water use
(including
in-stream) | 10 790 446 | 6 072 877 | 3 297 847 | 2 519 | 1 848 574 | 38 278 970 | 1 138 | - | 60 292 371 |  |
 | Total water use
(excluding
in-stream) | 112 039 | 98 782 | 80 984 | 2 519 | 12 808 | 116 874 | 1 138 | - | 425 144 |  |
 | Water consumption | 75 214 | 98 757 | 80 506 | 2 517 | 12 806 | 97 | 1 138 | - | 271 035 |  |
| 2000-01 |  |  |  |  |  |  |  |  |  |  |
 | Self-extracted | 8 023 412 | 6 087 306 | 1 448 997 | 595 | 1 711 684 | 37 404 500 | 661 | - | 54 677 155 |  |
 | Distributed | 9 330 | 20 642 | 72 551 | 756 | 1 746 | 36 | - | - | 105 060 |  |
 | Reuse | 1 210 | 2 766 | 106 | 720 | - | - | - | - | 4 802 |  |
 | Total water use
(including
in-stream) | 8 033 952 | 6 110 714 | 1 521 654 | 2 071 | 1 713 430 | 37 404 536 | 661 | - | 54 787 017 |  |
 | Total water use
(excluding
in-stream) | 68 187 | 107 903 | 74 049 | 2 071 | 14 375 | 36 | 661 | - | 267 282 |  |
 | Water consumption | 59 200 | 107 767 | 70 855 | 1 709 | 14 372 | 36 | 661 | - | 254 600 |  |
|  |
| - nil or rounded to zero (including null cells) |
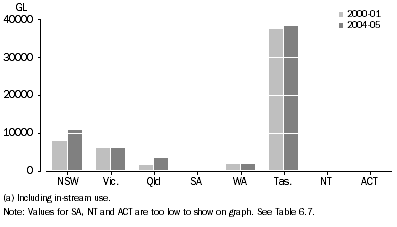
Graph 1.30 shows total water use by electricity generators by State and Territory for 2004-05. The largest user was Tasmania, which used a total of 38,279 GL in 2004-05. The next largest users were New South Wales (10,790 GL) and Victoria (6,073 GL).
1.30 Water use(a), electricity generators - 2000-01 and 2004-05
HOUSEHOLDS
This section presents data on water use by Australian Households, also referred to as domestic water use. For the purpose of the Water Account, water used by Households is defined as any water that is used for human consumption (such as for drinking and cooking) as well as water used by Households for cleaning or outdoors (such as water for gardens and swimming pools).
Water Consumption
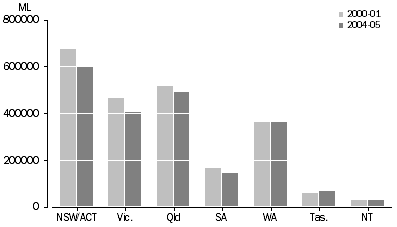
Graph 1.31 shows that New South Wales consumed the largest volume of water for Household use (572,711 ML) followed by Queensland (492,908 ML) and Victoria (404,632 ML), broadly in line with population for the States and Territories. Total Household water consumption decreased in all States and Territories from 2000-01 to 2004-05 with the exception of Tasmania. The largest percentage decrease in total Household water consumption was in the Australian Capital Territory (15%) followed by South Australia (13%).
1.31 Water consumption, households - 2000-01 and 2004-05
Water Source
Of the total water consumed by Households in 2004-05, 89% was distributed water and 11% was water from a self-extracted source (i.e. rainwater tanks and direct extraction from surface or groundwater) (Table 1.32). In 2000-01 Households sourced a similar proportion of total water consumption from distributed water (90%). Western Australia had the highest percentage of use of a self-extracted source (38%) followed by the Northern Territory (18%).
1.32 Household water consumption, by water type - 2000-01 and 2004-05 |
|  |
 | Australia | 2004-05 |  |
 | 2000-01 | 2004-05 | NSW | Vic. | Qld | SA | WA | Tas. | NT | ACT |  |
 | ML | ML | ML | ML | ML | ML | ML | ML | ML | ML |  |
|  |
| Self-extracted | 221 550 | 232 446 | 25 521 | 15 641 | 34 992 | 2 161 | 135 890 | 12 526 | 5 715 | - |  |
| Distributed | 2 056 455 | 1 874 050 | 545 423 | 388 991 | 457 916 | 142 279 | 226 151 | 56 905 | 25 396 | 30 989 |  |
| Reuse | 167 | 1 767 | 1 767 | - | - | - | - | - | - | - |  |
| Total | 2 278 173 | 2 108 263 | 572 711 | 404 632 | 492 908 | 144 440 | 362 041 | 69 431 | 31 111 | 30 989 |  |
|  |
| - nil or rounded to zero (including null cells) |
| Sums may not necessarily equal totals due to rounding. |
Average Water Use
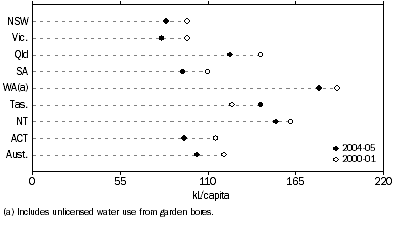
Australians on average consumed 103 kL/capita during 2004-05 compared to 2000-01 where average water consumption per capita was 120 kL/capita (Graph 1.33). Western Australia reported the highest Household water consumption per capita (180 kL/capita), followed by Northern Territory (153 kL/capita). Victoria had the lowest average Household water consumption per capita (81 kL/capita) followed by New South Wales (84 kL/capita).
1.33 Household water consumption, per capita - 2000-01 and 2004-05
WATER ACCESS ENTITLEMENTS, ALLOCATIONS AND TRADING
This section presents a summary on the number of water access entitlements, the volume of water allocated to water access entitlements, and water trading in Australia in 2004-05. All data have been provided by the relevant Government agencies in each State and Territory, or obtained from publicly available sources. Detailed data at the State, Territory and water management area level are presented in the publication Water Access Entitlements, Allocations and Trading, Australia, 2004-05 (cat. no. 4610.0.55.003).
Water Access Entitlements and Allocations
A water access entitlement is a perpetual or ongoing entitlement to exclusive access to a share of water from a specified consumptive pool as defined in the relevant water plan. The entitlement volume is the share or base volume of water associated with a water access entitlement.
A water allocation is the specific volume of water allocated to a water access entitlement in a given season, defined according to rules established in the relevant water plan. The allocated volume is the specific volume of water allocated to water access entitlements for the reference year.
In 2004-05, there were 223,556 water access entitlements in Australia with a total entitlement volume of 29,831 GL (Table 1.34). New South Wales had the highest number of water access entitlements in Australia, with 118,110 (or 53%) of the total water access entitlements in Australia. New South Wales also had the highest entitlement volume in Australia in 2004-05, with 13,302 GL (or 45%) of the total entitlement volume.
1.34 Water access entitlements and allocations - 2004-05 |
|  |
 | Number of entitlements | Entitlement volume | Allocated volume |  |
 | no. | ML | ML |  |
|  |
| NSW(a) | 118 110 | 13 301 851 | 9 798 575 |  |
| Vic.(b) | 25 514 | 6 680 334 | 4 733 845 |  |
| Qld(c) | 48 591 | 4 397 481 | na |  |
| SA | 10 399 | 1 660 584 | 1 660 584 |  |
| WA | 17 513 | 2 546 643 | 2 546 643 |  |
| Tas. | 3 110 | 1 038 419 | 1 038 419 |  |
| NT | 166 | 139 959 | 139 959 |  |
| ACT | 153 | 66 150 | 66 150 |  |
| Australia | 223 556 | 29 831 421 | na |  |
|  |
| na not available |
| (a) Maximum available water has been used for allocated volume in New South Wales. |
| (b) Volume taken has been used as a proxy for allocated volume in Victoria. |
| (c) Excludes 1,931 water licences without a volumetric entitlement volume in Queensland. |
Water Trading
Australia is one of a small number of water-scarce countries that has instituted markets for trading water. While not explicitly defined in the NWI, water trading is the term used to describe transactions involving water access entitlements or the water allocations assigned to water access entitlements. Trading can occur on a permanent or temporary basis.
Permanent water trades are transactions that permanently affect some aspect of a water access entitlement, such as changes to the ownership, water source, size of share, or reliability of the water access entitlement. With the separation of water access entitlements from land titles, a permanent water trade may involve a change of ownership, a change of location, or both. It should be noted that permanent trading data for New South Wales, Western Australia and Tasmania include trades that result in ownership changes from land sales, while Queensland has excluded these transactions. Therefore, comparisons between jurisdictions should be made with caution.
Temporary water trades are transactions that affect the seasonal water allocation associated with a water access entitlement, that is, the specific volume of water allocated to water access entitlements in a given season. They are generally conducted through leasing arrangements for a period of a year or less.
In 2004-05, 1,802 permanent and 13,456 temporary water trades were conducted in Australia with 248 GL of water traded permanently and 1,053 GL of water traded temporarily (Tables 1.35 and 1.36). The highest number of permanent and temporary water trades were conducted in Victoria (702 and 9,323 respectively). Victoria also had the highest volume of water temporarily traded in Australia with 444 GL. The highest volume of water traded permanently occurred in Western Australia with 63 GL.
1.35 Permanent water trading - 2004-05 |
|  |
 | water traded within | water traded into | water traded out | total water traded(a) | average price |  |
 | no. | ML | no. | ML | no. | ML | no. | ML | $/ML |  |
|  |
| NSW | 154 | 40 846 | 10 | 436 | - | - | 164 | 41 282 | na |  |
| Vic.(b) | 656 | 52 175 | - | - | 46 | 5 214 | 702 | 57 389 | na |  |
| Qld | 168 | 20 285 | - | - | - | - | 168 | 20 285 | 1 750 |  |
| SA | 328 | 28 643 | 36 | 4 778 | - | - | 364 | 33 421 | na |  |
| WA | 218 | 62 810 | - | - | - | - | 218 | 62 810 | 680 |  |
| Tas. | 232 | 37 603 | - | - | - | - | 232 | 37 603 | na |  |
| NT | - | - | - | - | - | - | - | - | - |  |
| ACT | - | - | - | - | - | - | - | - | - |  |
| Australia | 1 756 | 242 362 | 46 | 5 214 | 46 | 5 214 | 1 802 | 247 576 | na |  |
|  |
| - nil or rounded to zero (including null cells) |
| na not available |
| (a) Total for Australia cannot be calculated by taking the sum of the States and Territories as this would double count interstate trades. |
| (b) Sourced from the annual reports of rural water authorities in Victoria. |
1.36 Temporary water trading - 2004-05 |
|  |
 | Water traded within | Water traded into | Water traded out | Total water traded(a) | Average price |  |
 | no. | ML | no. | ML | no. | ML | no. | ML | $/ML |  |
|  |
| NSW(b) | 1 739 | 316 506 | 117 | 37 848 | 186 | 28 196 | 2 042 | 382 550 | 96 |  |
| Vic.(c) | 9 042 | 396 723 | 179 | 19 259 | 102 | 28 281 | 9 323 | 444 263 | na |  |
| Qld | 1 874 | 194 195 | - | - | - | - | 1 874 | 194 195 | na |  |
| SA | 314 | 49 525 | 72 | 24 560 | 80 | 25 190 | 446 | 49 525 | na |  |
| WA | 8 | 8 617 | - | - | - | - | 8 | 8 617 | 80 |  |
| Tas. | 111 | 5 601 | - | - | - | - | 111 | 5 601 | na |  |
| NT | - | - | - | - | - | - | - | - | - |  |
| ACT | - | - | - | - | - | - | - | - | - |  |
| Australia | 13 088 | 971 168 | 368 | 81 667 | 368 | 81 667 | 13 456 | 1 052 834 | na |  |
|  |
| - nil or rounded to zero (including null cells) |
| na not available |
| (a) Total for Australia cannot be calculated by taking the sum of the States and Territories as this would double count interstate trades. |
| (b) Average price for New South Wales is only for those trades where price data were available. |
| (c) Sourced from the annual reports of rural water authorities in Victoria. |
WATER STOCKS
This section presents information on Australia's water stocks and water storage infrastructure. This section of the Water Account has benefited from data on water resources compiled by the Bureau of Rural Sciences (BRS), CSIRO and Bureau of Meteorology, as well as improved data availability on dam storage from water providers and State and Territory governments. For water stocks it has allowed additional information on rainfall, run-off and dam storage levels to be included.
PHYSICAL WATER STOCKS
The data on rainfall in this account were provided by the Australian Bureau of Meteorology and the Bureau of Rural Sciences (BRS). Data on run-off, evapotranspiration and deep drainage (groundwater recharge and river base flow) were provided by the BRS. The modelling methods used to estimate run-off, evapotranspiration and deep drainage are described in Welsh et al. (2006) and are based on the work of Zhang et al. (2004, 2005) and Fu (1981).
Rainfall and runoff
For 2004-05, rainfall for Australia was estimated at 2,789,424 GL, the majority in Queensland (865,973 GL) followed by Western Australia (639,609 GL) and the Northern Territory (505,623 GL) (Table 1.37). Run-off for Australia was determined to be approximately 242,779 GL. The distribution of run-off was geographically uneven at the State and Territory level. Run-off was greatest in Queensland (93,018 GL) followed by the Northern Territory (47,151 GL) and Tasmania (32,084 GL).
1.37 Rainfall, run-off and land area - 2004-05 |
|  |
 | NSW | Vic. | Qld | SA | WA | Tas. | NT | ACT | Australia |  |
|  |
| Rainfall (GL) | 406 562 | 146 928 | 865 973 | 147 773 | 639 609 | 75 189 | 505 623 | 1 767 | 2 789 424 |  |
| Evapotranspiration (GL) | 369 163 | 129 967 | 759 355 | 143 563 | 601 867 | 41 877 | 450 090 | 1 589 | 2 497 471 |  |
| Run-off (GL) | 30 266 | 14 266 | 93 018 | 1 285 | 24 560 | 32 084 | 47 151 | 149 | 242 779 |  |
| Deep drainage (GL) | 7 133 | 2 695 | 13 599 | 2 925 | 13 182 | 1 228 | 8 382 | 29 | 49 174 |  |
| Bare ground (km2) | 979 | 543 | 2 440 | 18 437 | 15 178 | 239 | 1 466 | 2 | 39 284 |  |
| Agricultural land (km2)(a) | 498 850 | 148 101 | 1 013 792 | 863 322 | 1 968 677 | 24 048 | 1 078 043 | 707 | 5 595 540 |  |
| Forests and plantations (km2) | 297 378 | 69 451 | 696 563 | 85 976 | 518 303 | 41 224 | 262 755 | 1 466 | 1 973 116 |  |
| Intensive use / urban (km2) | 2 645 | 3 037 | 2 239 | 909 | 697 | 275 | 141 | 180 | 10 123 |  |
| Water (km2) | 6 301 | 3 620 | 10 560 | 10 686 | 19 627 | 1 310 | 2 470 | 8 | 54 582 |  |
| Total land area (km2) | 804 059 | 226 846 | 1 725 594 | 979 330 | 2 522 482 | 67 096 | 1 344 875 | 2 363 | 7 672 645 |  |
|  |
| (a) Includes dryland farming, irrigated areas and pasture. |
| Bureau of Rural Sciences, unpublished data |
DAMS
Location
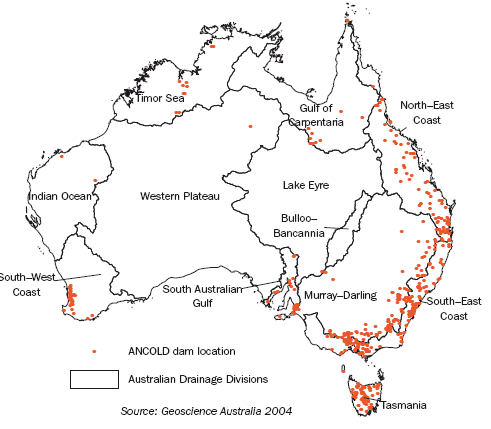
The location of large dams is influenced by topography, proximity to population and industry, and availability of run-off. Map 1.38 shows the location of large dams, by drainage division, throughout Australia.
1.38 Location of large dams, by drainage division-June 2005
Storage Levels
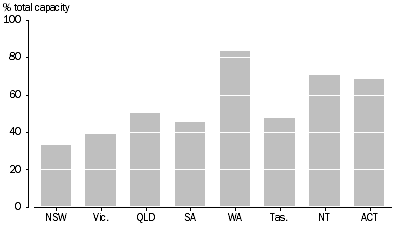
At 30 June 2005, there was 39,959 GL of water stored in large dams. The amount stored varies significantly between States and Territories (Graph 1.39). In June 2005 large dams in Western Australia (83%) and the Northern Territory (70%) had the highest storage levels in percentage terms. New South Wales (33%) and Victoria (39%), the States with the highest populations, had large dams with the lowest storage levels.
1.39 Large dam storage levels - June 2005
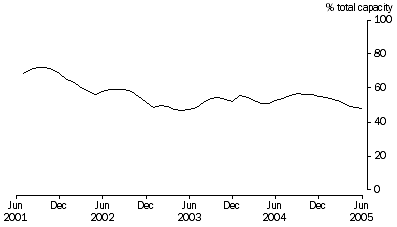
Graph 1.40 illustrates how Australian water storage changed from 2001 to 2005. Drought conditions in 2002 and 2003 are reflected in the reduction of more than 20% of the water stored in large dams. Storage has not recovered to pre-2002 levels.
1.40 Large dam storage levels, Australia - 2001 to 2005
 Print Page
 Print All