7218.0.55.001 - Livestock and Meat, Australia, Feb 2016 Quality Declaration 
ARCHIVED ISSUE Released at 11:30 AM (CANBERRA TIME) 07/04/2016   
   Page tools: Print Print Page Print all pages in this productPrint All


FEBRUARY KEY TREND FIGURES

LIVESTOCK SLAUGHTERED AND MEAT PRODUCED, Australia, February 2016


January 2016
February 2016
Jan 2016 to Feb 2016
Feb 2015 to Feb 2016

Livestock (no.)
Cattle (a)
660 697
650 066
-1.6%
-17.9%
Calves
33 911
31 104
-8.3%
-49.0%
Sheep
670 307
655 957
-2.1%
-10.6%
Lambs
1 954 672
1 962 799
0.4%
1.9%
Pigs
413 617
413 649
0.0%
-0.4%
Meat (t)
Beef
189 197
187 393
-1.0%
-15.4%
Veal
1 601
1 486
-7.2%
-56.5%
Mutton
15 910
15 568
-2.1%
-10.0%
Lamb
43 818
44 082
0.6%
2.9%
Pig Meat
31 101
31 072
-0.1%
-1.0%

(a) Excludes calves


Graph Image for Number of Livestock Slaughtered, Australia
Graph Image for Meat Production, Australia

FEBRUARY KEY POINTS

Livestock and meat production monthly trend movements for February 2016:
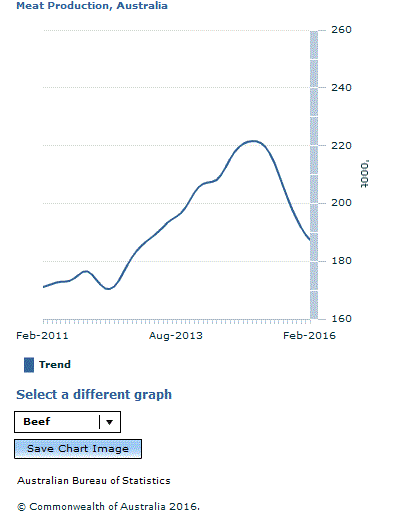
    • Cattle slaughter and production declined further in February 2016 due to reduced cattle supply.
    • Calf slaughter decreased in February 2016. The decreasing trend in calf slaughter reflects changes in the management of dairy calves in a number of regions.
    • Sheep slaughter and production dropped slightly in February 2016.
    • Lamb slaughter and production increased in February 2016.
    • Pig slaughter and production remained steady in February 2016.