NOTES
ABOUT THIS PUBLICATION
This publication presents national crime statistics relating to victims of a selected range of offences that have been recorded by police. These statistics provide indicators of the level and nature of recorded crime victimisation in Australia and a basis for measuring change over time. As not all crimes are reported to or recorded by police, other data sources can assist in providing a more comprehensive view of crime levels in society.
INTERPRETATION OF RESULTS
The statistics contained in this publication are derived from administrative systems maintained by state and territory police. Although national standards and classifications are used, differences over time in the level of recorded crime may reflect factors other than a change in the incidence of crime. Over time there have been significant changes in police recording systems, business rules and legislation resulting in some discrepancies remaining between states and territories for some offence types. Short term effects on the level of crime recorded by police may also occur as a result of individual jurisdictional initiatives, such as special task forces formed to combat particular offences, or implementation of proactive policing campaigns to encourage reporting by the public. Details of differences that impact on the statistics are in the Explanatory Notes paragraphs 19 to 74.
The Australian Bureau of Statistics (ABS) is working with police agencies to develop a National Crime Recording Standard (NCRS) to further improve the national comparability of the Recorded Crime Victims collection. (See Explanatory Notes paragraph 17).
CHANGES IN THIS ISSUE
To facilitate more appropriate use of recorded crime statistics, an index measure has been introduced in this issue. Indexes are useful to understand and analyse changes over time within a jurisdiction and are not recommended for direct comparison across jurisdictions. (See Explanatory Notes paragraphs 87 to 90).
National data for assault and sexual assault are not available due to significant differences in recording practices across jurisdictions for these offence types. While data for assault and sexual assault are included for individual states and territories, they are based on the particular recording practices adopted in each jurisdiction and should not be used to compare these offence types across jurisdictions. Results from the 2005 National Crime and Safety Survey have been included in the Summary of Findings as they provide national data on victimisation, including assault and sexual assault, that complements the 2005 recorded crime series.
FURTHER INFORMATION
More information about ABS activities in the field of crime and justice statistics is available from the Crime and Justice theme page on the ABS web site.
ACKNOWLEDGMENTS
The ABS acknowledges the valuable contribution of the Board of Management of the National Crime Statistics Unit, the National Crime Statistics Advisory Group and the staff of the various agencies that provide the statistics that are presented in this publication.
INQUIRIES
For further information about these and related statistics, contact the National Information and Referral Service on 1300 135 070 or Nick Skondreas on Melbourne (03) 9615 7375.
SUMMARY OF FINDINGS
INTRODUCTION
This publication presents statistics on incidents of victimisation for a selected range of offences that came to the attention of police and were recorded by them in the period 1 January 2005 to 31 December 2005.
When an incident of crime victimisation occurs, there are a number of ways in which this can be measured and a number of stages where a measurement can be taken; from the time that a person perceives they have been a victim through to reporting to police and the laying of charges. From among a range of possible ways of measuring crime, there are two major sources of data produced by the ABS that can inform the user about crime victimisation. The first of these is a measure of crimes reported to and recorded by police; and the second is direct reports from members of the public about their experiences of crime as collected in household surveys. Neither of these sources will provide a definitive measure of crime victimisation, but together they provide a more comprehensive picture of victimisation than either measure alone. Both sources have a number of limitations, however, of which users should be aware.
Recorded crime statistics are the result of incidents coming to police attention and a subsequent decision making process carried out by police in accordance with the criminal law. As such they are subject to different legislation, rules of operation and procedures in different jurisdictions. A 'differences in recorded crime' project completed by the ABS in 2005 found that differences between jurisdictions in police recording systems, business rules, procedures and legislation can partly explain differences in recorded crime across states and territories for certain offence types, in addition to changes in the incidence of criminal victimisation. This is particularly so for assault and sexual assault. As a result this publication does not present national statistics for these two offence categories although data for states and territories are presented. However, national level information for these offences, as well as some comparative data for a range of other offences, are available from the 2005 ABS National Crime and Safety Survey and are presented below to complement the recorded crime data.
For further information about differences across jurisdictions refer to paragraphs 19 to 74 of the Explanatory Notes.
SELECTED RESULTS FROM THE ABS 2005 CRIME VICTIMISATION SURVEY
The National Crime and Safety Survey is conducted periodically by the ABS and was last conducted during April to July 2005. The survey collected information from individuals and households about their experience of some selected crimes, whether they reported these crimes to police, and crime-related risk factors experienced in the 12 months prior to the survey. The crimes for which information was obtained include: household crimes comprising break-in, attempted break-in and motor vehicle theft; and personal crimes comprising robbery, assault, and sexual assault.
From the survey, the following victimisation rates (proportion of persons or households experiencing a crime) were obtained:
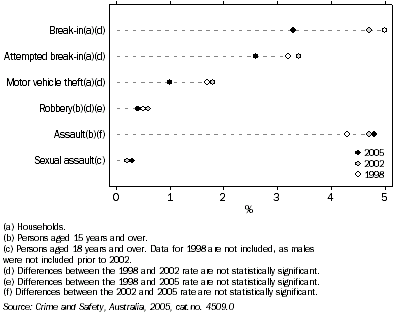
- Assault increased from 4.3% of persons in 1998 to 4.8% in 2005. Movements between 2002 and 2005 were not statistically significant for this offence type.
- Sexual assault was 0.3% of persons in 2005.
- Break-in to a home, garage or shed decreased from 5.0% of households in 1998 to 3.3% in 2005, while attempted break-in decreased from 3.2% to 2.6%. Motor vehicle theft decreased from 1.7% of households in 1998 to 1.0% in 2005.
- Robbery decreased from 0.6% of persons in 2002 to 0.4% in 2005. Movements between 1998 and 2002 were not statistically significant for this offence.
CRIME VICTIMISATION RATES
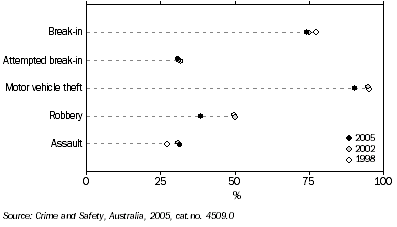
The proportion of victims who reported to police the most recent incident of crime they experienced varied depending on the type of offence. Household crimes were more likely to be reported to police than personal crimes. In 2005, 74% of victims of break-in and 90% of victims of motor vehicle theft reported the most recent incident to police, compared to 38% of robbery victims and 31% of assault victims.
CRIME reporting RATES
Further detailed information about these survey results can be found in Crime and Safety, Australia, 2005 (ABS cat. no. 4509.0).
RECORDED NATIONAL CRIME VICTIMISATION LEVELS
The remainder of this Summary of Findings discusses results from the Recorded Crime, Victims collection for 2005. Caution should be exercised when comparing results for recorded crime and data from the National Crime and Safety Survey. The two data sets have different scope and coverage, are based on different methods of measurement, and have different sources of error. For further information see paragraphs 93 to 94 of the Explanatory Notes.
Measuring crime victimisation
Victims in the recorded crime collection can be a person, premise or organisation depending on the type of offence. A person reporting a crime with multiple offences may be counted multiple times depending on the type of offences. For example, a victim who was robbed and abducted would be counted separately as a victim under the offences of robbery and kidnapping/abduction. Conversely, a victim of multiple assaults would be counted only once. For these reasons, it is not meaningful to aggregate the number of victims across each offence type and produce a 'total number of victims'; it is only meaningful to look at victim counts within each offence category.
For further information about the scope and counting methodology of this collection refer to paragraphs 3 to 9 and 76 to 83 of the Explanatory Notes.
Number of victims
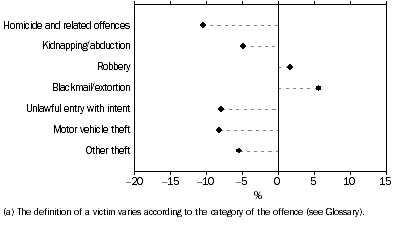
The number of victims recorded by Australian police declined in most offence categories in 2005 when compared to 2004. The number of victims of homicide and related offences decreased by 10%, while victims of motor vehicle theft and unlawful entry with intent both decreased by 8%. Other theft and kidnapping/abduction both decreased by 5%.
Increases were recorded for blackmail/extortion (6%) and robbery (2%).
VICTIMS(a), Percentage change in number - 2004 to 2005
In 2005, the victimisation rates for motor vehicle theft (397 per 100,000 population) and unlawful entry with intent (1,398 per 100,000 population) were the lowest since national reporting began in 1993, while homicide and related offences remained the same as 2004 (4 per 100,000 population). The victimisation rate for other theft was the lowest since 1995 (2,554 per 100,000 population).
The victimisation rate for robbery increased by less than 1% from the 2004 rate to 83 per 100,000 population.
Although national data is not available for assault and sexual assault in this publication due to differences in recording practices, assault had increased for all jurisdictions in 2005, compared to 2004. A number of jurisdictions have introduced new procedures or legislation relating to domestic and family violence, which may have affected these results.
Sexual assault decreased in most states and territories during 2005.
Sex and age of victim
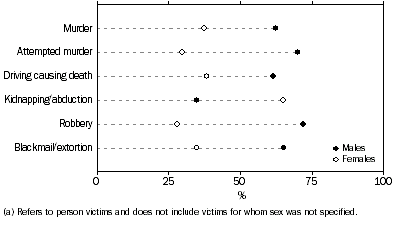
In 2005, more males than females were victims of robbery (71% of victims were male), attempted murder (68%), blackmail/extortion (64%), murder (62%) and driving causing death (46%). The reverse was the case for kidnapping/abduction (64% of victims were female).
VICTIMS(a), Selected offence categories by sex
Persons aged 25 years or older comprised approximately 70% of recorded victims of blackmail/extortion, murder and attempted murder. In contrast, this age group comprised approximately one in four victims of kidnapping/abduction. Those aged 25-34 years were twice as likely to be victims of attempted murder than the general population.
Over half of the victims of kidnapping/abduction (54%) were under 20 years of age. This offence had the highest proportion of victims aged 0-14 years (36%). Persons aged 10-14 years were nearly three times more likely to be victims of kidnapping/abduction than the general population.
Persons aged 15-19 years were just over three times more likely to be victims of robbery than the general population.
VICTIMS(a), Selected offence categories by age group
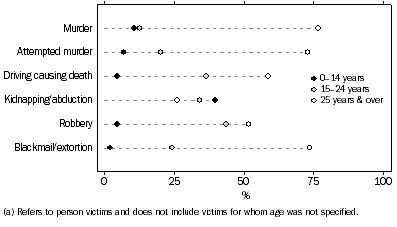
Further variation existed across certain offence categories when classified by age and sex.
Males aged 25-34 were three times more likely to be a victim of attempted murder than females of the same age group.
For kidnapping/abduction those aged 10-14 had the highest victimisation rate for males (8 per 100,000 population), while for females the slightly higher age group of 15-19 years had the highest victimisation rate for this offence (15 per 100,000 population).
The victimisation rate for robbery was the highest in the 20-24 year age group for females (101 per 100,000 population). For males the 15-19 year age group was the highest for this offence type (338 per 100,000 population).
Location of offence
In 2005, most victims of murder (64%) and attempted murder (54%) were subjected to these offences in a residential location. For victims of motor vehicle theft, this offence was most likely to have occurred in a community location (53%), followed by a residential location (28%). Unlawful entry with intent was most likely to have occurred in a residential location (66%). Nearly three in five robbery victims were subjected to this offence in a community location, with three quarters of these occurring on a street/footpath and 9% in a transport services and facilities location. Three in five victims of kidnapping/abduction were taken from a community location, and a further one quarter taken were from a residential location. Over one quarter of victims of other theft were subjected to this offence in a retail location.
VICTIMS(a), Selected offences occurring at residential, community and other locations
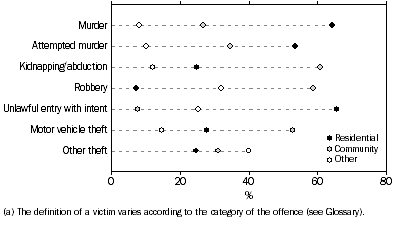
Weapon use
In 2005, the most common offences for which a weapon was used were attempted murder (72%) and murder (59%). A knife was the most common type of weapon used and was involved in nearly one third of murders (30%) and attempted murders (29%). A firearm was involved in 18% of attempted murders, 10% of murders and 5% of robberies.
VICTIMS(a), Weapon used in commission of offence
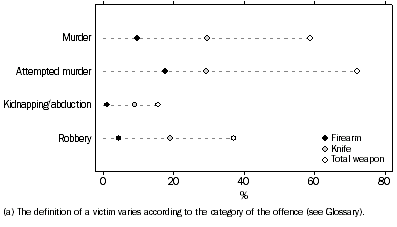
Murders involving a weapon increased by 7% from 2004, but were 15% lower than in 2001. The proportion of weapon use for this offence was similar in 2005 compared to 2001 (59% in 2005 compared to 60% in 2001).
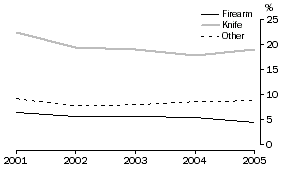
The proportion of robberies in which a weapon was used declined from 42% in 2001 to 37% in 2005. The proportions have remained relatively stable since 2002, ranging from 36% to 37%.
The proportion of kidnappings/abductions where a weapon was used increased from 13% in 2004 to 16% in 2005; however, the 2005 proportion was lower than that recorded in 2001 (21%).
A knife was used in 30% of murders recorded in 2005, the highest proportion since 2001 (29%), while the use of firearms for this offence continued to decline for this same period, from 16% in 2001 to 10% in 2005. Murders involving other weapons comprised 15% of the total.
Victims, Weapon used in commission of murder
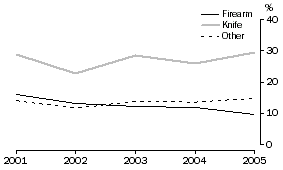
The use of knives was more prevalent for robberies than firearms, comprising 19% of all robberies. This proportion was slightly higher than the proportion in 2004 (18%), but lower than that recorded in 2001 (23%). Firearms accounted for 5% of total robberies in 2005, a slight decline from the proportions recorded in the preceding four years (around 6% of all robberies). Other weapon use ranged between 8% and 9% during the period 2001 to 2005.
Victims, Weapon used in commission of robbery
Outcome of investigation
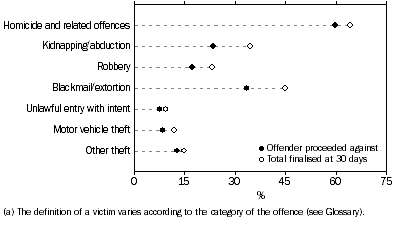
In 2005, approximately two-thirds of the investigations into driving causing death (68%), attempted murder (65%) and murder (64%) were finalised within 30 days of a victim becoming known to police.
The lowest proportions of finalisations at 30 days were for victims of unlawful entry with intent (9%), motor vehicle theft (12%) and other theft (15%). However, of the total finalised for these offence types, a high proportion had an offender proceeded against by police: other theft (85%), unlawful entry with intent (81%) and motor vehicle theft (72%).
The highest proportions of investigations finalised where there was no offender proceeded against were for victims of kidnapping/abduction (32%), motor vehicle theft (28%), blackmail/extortion (26%) and robbery (25%).
VICTIMS(a), Outcome of investigation at 30 days
 Print Page
 Print All