MARCH KEY FIGURES
 | | Mar qtr 06 | Dec qtr 05 to Mar qtr 06 | Mar qtr 05 to Mar qtr 06 | |
| | $m | % change | % change | |
TREND ESTIMATES(a) | |
| |
| Value of work done | | | | |
| Building | 13 239.1 | -2.1 | -2.0 | |
| Residential | 8 301.1 | -3.6 | -7.2 | |
| Non-residential | 4 917.5 | 0.2 | 7.9 | |
| Engineering | 9 772.1 | 3.7 | 21.7 | |
| Total construction | 23 056.2 | 0.5 | 7.1 | |
SEASONALLY ADJUSTED ESTIMATES(a) | |
| |
| Value of work done | | | | |
| Building | 13 266.8 | -0.7 | 1.1 | |
| Residential | 8 313.0 | -2.4 | -4.5 | |
| Non-residential | 4 953.8 | 2.2 | 12.2 | |
| Engineering | 9 724.9 | 1.5 | 18.1 | |
| Total construction | 22 991.7 | 0.2 | 7.7 | |
| |
| (a) Reference year for Chain Volume Measures is 2003-04. |
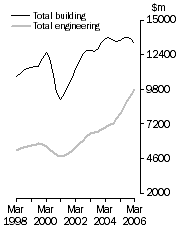
Value of construction work done, Volume terms - Trend estimates
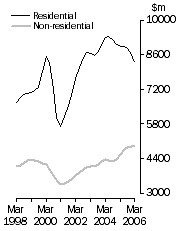
| Value of building work done, Volume terms - Trend estimates
|
MARCH KEY POINTS
VALUE OF CONSTRUCTION WORK DONE, VOLUME TERMS
TREND ESTIMATES
- The trend estimate for building work done fell 2.1% in the March quarter 2006. Residential building fell 3.6%, while non-residential rose 0.2%.
- Engineering work done rose 3.7% in the March quarter 2006.
- Total construction work done rose 0.5% in the latest quarter.
SEASONALLY ADJUSTED ESTIMATES
- The seasonally adjusted estimate of building work done fell 0.7% in the March quarter 2006, to $13,266.8m. Residential building fell 2.4%, to $8,313.0m. Non-residential building rose 2.2%, to $4,953.8m.
- Engineering work done rose 1.5%, to $9,724.9m, in the March quarter 2006, the highest level on record. Work done for the private sector fell 3.9%, to $5,649.1m. Work done for the public sector rose 10.0%, to $4,075.8m.
- Total construction work done rose 0.2%, to $22,991.7m, in the latest quarter, also the highest level on record.
NOTES
FORTHCOMING ISSUES
| ISSUE (QUARTER) | Release Date |
| June 2006 | 30 August 2006 |
| September 2006 | 29 November 2006 |
ABOUT THIS ISSUE
This publication provides an early indication of trends in building and engineering construction activity. The data are estimates based on a response rate of approximately 80% of the value of both building and engineering work done during the quarter. More comprehensive and updated results will be released in Building Activity, Australia (cat. no. 8752.0) on 19 July 2006 and in Engineering Construction Activity, Australia (cat. no. 8762.0) on 18 July 2006.
CHANGES IN THIS ISSUE
Time series spreadsheets 11, 12 and 13 have been released in Excel format for the first time with this issue. The new Excel spreadsheets are available in Information Paper, Changes to Time Series Spreadsheets for Construction Work Done, Australia, Preliminary (cat. no. 8755.0.55.002). The information paper is on the ABS web site at <www.abs.gov.au>. From the home page go to 'Access to all ABS products and statistics' search by 'catalogue number' and choose '87. Building and construction'.
DATA NOTES
As a survey of approved building jobs, outcomes from the Building Activity Survey are subject to the accuracy of Building Approvals information used in preparing the collection. Some errors have been identified in Building Approvals information for a number of regions in Australia over recent years. Adjustments were made to the affected Building Approvals series and revisions were incorporated into the March 2006 issue of Building Approvals, Australia (cat. no. 8731.0), released on 5 May 2006.
As a result of the changes in the Building Approvals series there will be corresponding revisions to other building series. These will be incorporated from the June 2006 quarter issue of Construction Work Done, Australia, Preliminary (cat. no. 8755.0) released on 30 August 2006, Dwelling Unit Commencements, Australia, Preliminary (cat. no. 8750.0), released on 14 September 2006 and Building Activity, Australia (cat. no. 8752.0), released on 13 October 2006.
INQUIRIES
For further information about these and related statistics, contact the National Information and Referral Service on 1300 135 070 or Paul Pamment on Adelaide (08) 8237 7499.
CONSTRUCTION WORK DONE CHAIN VOLUME MEASURES
TREND PERCENTAGE CHANGE
TOTAL CONSTRUCTION
The total value of construction work done rose for the sixth successive quarter, but the rate of growth has slowed over recent quarters.
ENGINEERING
Engineering construction work done has increased for twenty successive quarters.
BUILDING
Total building work done is showing falls for the past two quarters.
RESIDENTIAL
Residential building work done has fallen for the last three quarters.
NON-RESIDENTIAL
Non-residential work done has risen in the last six quarters, with the rate of growth slowing over recent quarters.
CONSTRUCTION WORK DONE STATES AND TERRITORIES
CHAIN VOLUME MEASURES - TREND ESTIMATES
NEW SOUTH WALES
VICTORIA
Construction work done in New South Wales has fallen for the last two quarters. In Victoria, construction work done is now showing falls for two quarters.
QUEENSLAND
WESTERN AUSTRALIA
Construction work done has grown in Queensland for the last eleven quarters. Construction work done in Western Australia has grown for the last nine quarters.
SOUTH AUSTRALIA
TASMANIA
Construction work done in South Australia has fallen for four quarters. In Tasmania, construction work done is now showing rises for five quarters.
NORTHERN TERRITORY
AUSTRALIAN CAPITAL TERRITORY
Construction work done in the Northern Territory has risen marginally in the latest quarter, after two quarters of decline. The Australian Capital Territory shows growth for the past five quarters.
 Print Page
 Print All