NOTES
FORTHCOMING ISSUES
| ISSUE (QUARTER) | Release Date |
| September 2006 | 13 December 2006 |
| December 2006 | 14 March 2007 |
| March 2007 | 13 June 2007 |
CHANGES TO THIS ISSUE
There are no changes in this issue.
INQUIRIES
For further information about these and related statistics, contact the National Information and Referral Service on 1300 135 070 or Heather Jackson on Sydney (02) 9268 4357.
SUMMARY OF FINDINGS
MINERAL EXPLORATION (OTHER THAN FOR PETROLEUM)
TREND ESTIMATES
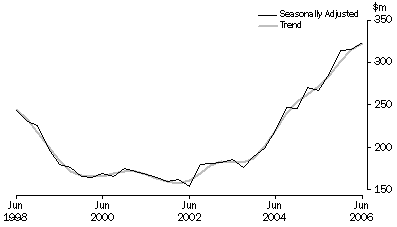
The trend estimate for total mineral exploration expenditure increased by 2.4% to $322.6m in the June quarter 2006. The estimate has risen in the past eleven quarters and is now 18.7% higher than the June quarter 2005 estimate.
Mineral Exploration, Seasonally adjusted and trend series

The largest contributions to the increase this quarter were in South Australia (up $4.4m or 11.1%) and Queensland (up $1.8m or 3.1%). Most states showed increasing expenditure levels this quarter, with only Western Australia showing a decrease ($0.6m or 0.4%).
The trend estimate for metres drilled increased by 0.6% this quarter. The current estimate is now 5.5% higher than the June quarter 2005 estimate.
MINERAL EXPLORATION (OTHER THAN FOR PETROLEUM)
EXPLORATION EXPENDITURE
The seasonally adjusted estimate of mineral exploration expenditure increased by $8.2m (2.6%) to $323.8m in the June quarter 2006. South Australia had the largest increase ($9.9m or 26.9%), while Queensland had the largest decrease ($2.4m or 4.0%).
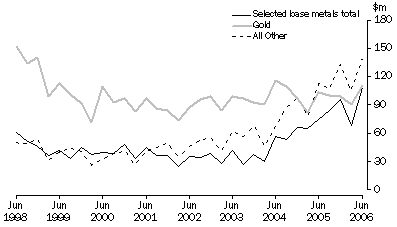
In original terms, mineral exploration expenditure increased by $93.7m (35.5%). Exploration on areas of new deposits increased by $25.2m (24.1%), while expenditure on areas of existing deposits increased by $68.4m (42.9%).
In original terms, the largest increase in expenditure by minerals sought came from copper exploration (up $22.1m or 89.8%), with the largest increase occurring in South Australia. The next largest increase came from expenditure on gold exploration (up $20.5m or 22.8%).
Mineral Exploration, Original series

MINERAL EXPLORATION (OTHER THAN FOR PETROLEUM)
METRES DRILLED
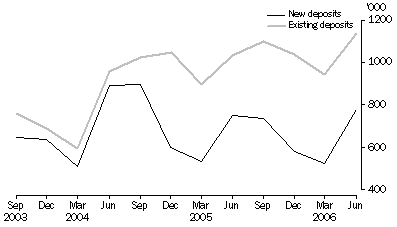
In seasonally adjusted terms, total metres drilled decreased by 1.8% in the June quarter 2006. In original terms total metres drilled increased by 30.6%. Drilling in areas of existing deposits increased by 20.6% and drilling in areas of new deposits increased by 48.8%.
Metres Drilled, Original series

PETROLEUM EXPLORATION
OVERVIEW
Expenditure on petroleum exploration for the June quarter 2006 increased by $106.3m (38.9%) to $379.9m.
Expenditure on exploration on production leases increased (by $24.9m or 29.5%), while exploration on all other areas increased (by $81.3m or 43.0%) this quarter.
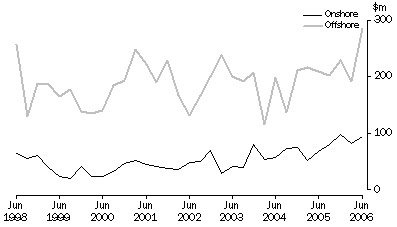
There was an increase of $92.8m (48.4%) in offshore exploration, while onshore exploration expenditure increased by $13.4m (16.3%).
Petroleum Exploration, Original series

REGIONAL DATA
All states showed increases in petroleum exploration expenditure in the June quarter 2006. Northern Territory had the largest increase ($60.5m or 112.5%), followed by Western Australia with an increase of $31.7m (23.1%).
 Print Page
 Print All