|
|
NOTES
ABOUT THIS PUBLICATION
This publication presents national crime statistics relating to victims of a selected range of offences that have been recorded by police. These statistics provide indicators of the level and nature of recorded crime victimisation in Australia and a basis for measuring change over time.
DATA CONSISTENCY
The statistics are derived from administrative systems maintained by state and territory police. Although national standards and classifications are used in the compilation of these statistics, some discrepancies remain between the states and territories. These are due to legislative and procedural differences between police jurisdictions. As part of its National Crime Statistics Quality Assurance Strategy, the Australian Bureau of Statistics (ABS) is working with police agencies to minimise the effect of these differences.
INTERPRETATION OF RESULTS
Differences over time in the level of recorded crime may reflect factors other than change in the incidence of crime. For example, as police implement changes to their recording practices and systems the information they record may be affected. Also, when police form special task forces to combat particular offences or implement campaigns to encourage reporting there may be effects on the level of victimisation recorded in the period. People's willingness to report crime may also change for other reasons. Refer to paragraphs 2 and 3, and 37 and 48 of the Explanatory Notes for further detail.
CHANGES IN THIS ISSUE
The tables with state and territory data on relationship of offender to victim (previously tables 4, 5 and 6) have been replaced with table 4. This provides national data for relationship of offender to victim, for the offence categories of murder, attempted murder, assault, sexual assault, kidnapping/abduction and blackmail/extortion.
FURTHER INFORMATION
More information about ABS activities in the field of crime and justice statistics is available from the Crime and Justice theme page on the ABS web site. To access the theme page, select Themes from the menu on the home page. Details of other ABS publications relating to crime and justice statistics can be found in paragraph 47 of the Explanatory Notes.
ACKNOWLEDGEMENTS
The ABS acknowledges the valuable contribution of the Board of Management of the National Crime Statistics Unit, the National Crime Statistics Advisory Group and the staff of the various agencies that provide the statistics that are presented in this publication.
INQUIRIES
For further information about these and related statistics, contact the National Information and Referral Service on 1300 135 070 or Nick Skondreas on Melbourne 03 9615 7381.
SUMMARY OF FINDINGS
INTRODUCTION
This publication presents statistics on victims of a selected range of offences which were recorded by state and territory police in Australia for the period 1 January 2003 to 31 December 2003. Data are also provided for individual years from 1994 onwards. While the statistics provide a measure of the level and nature of crime in Australia, users are referred to the Explanatory Notes for more detail on the exact scope and coverage of the Recorded Crime Victims Statistics collection and the counting rules applied.
As the collection is based on information that was recorded by police, it is important to note that the statistics include records of alleged offences which may later be withdrawn or proven to have no basis. Also, many incidents are not reported to police, with victims of personal crimes, such as assault and sexual assault, much less likely to report the offence to police than victims of property crimes.
Depending on the type of offence, a victim may be a person, a premise, an organisation or a motor vehicle. It is also possible that where one person was the subject of two or more offences during the one criminal incident (e.g. they were abducted and sexually assaulted) they would be counted as a victim of each offence (e.g. a victim of kidnapping/abduction and a victim of sexual assault). For these reasons, it is not meaningful to aggregate the number of victims across each offence type and produce a 'total number of victims'; it is only meaningful to look at victim counts within each offence category.
NATIONAL CRIME LEVELS
Overall the number of victims recorded by Australian police declined in most offence categories in 2003. This was particularly the case for offences involving the taking of property. Motor vehicle theft decreased by 13% and unlawful entry with intent decreased by 10%. Victims of robbery fell by 6%, with armed robbery falling by 9% and unarmed robbery by 5%. Other offence categories to record a decrease included other theft (6%), homicide and related offences (4%) and assault (1%).
VICTIMS(a), Change in number - 2002 to 2003
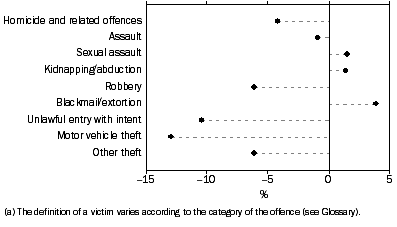
Other theft (which includes theft from persons, retail premises and motor vehicles) continues to be numerically the largest offence category. In 2003 there were 638,968 recorded victims of other theft, a decline of just over 40,000 since 2002.
In 2003, the victimisation rate for unlawful entry with intent (1,778 per 100,000 population) and motor vehicle theft (497 per 100,000 population) were the lowest since national reporting began in 1993. The robbery victimisation rate of 99 per 100,000 population was the lowest since 1997.
The assault victimisation rate for 2003 was 798 per 100,000 persons, a 2% decrease from 2002 (815 per 100,000). This was the first decrease in the victimisation rate for this offence category since 1995. The sexual assault victimisation rate increased from 71 to 92 per 100,000 persons between 1994 and 2003. In contrast, victimisation rates for homicide and related offences remained fairly stable over this period, ranging from 5 to 6 per 100,000 persons between 1994 and 2003.
Other offence categories for which there were increases between 2002 and 2003 in numbers of victims recorded, included blackmail/extortion (4%) and kidnapping/abduction (1%). Driving causing death (15%) also increased, but a 19% decrease in the number of victims of manslaughter, a 12% decrease in attempted murder and a 5% decrease in murders resulted in an overall decrease in victims for the homicide and related offences category.
VICTIM CHARACTERISTICS
Sex and age of victim
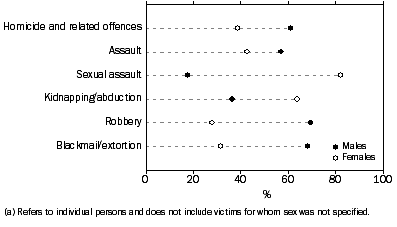
More males than females were victims of robbery and blackmail/extortion (68% of victims were male for both), murder and attempted murder (both 67%) and assault (57%). For sexual assault and kidnapping/abduction more females were victims than males (82% and 62%).
VICTIMS(a), Offence categories by sex
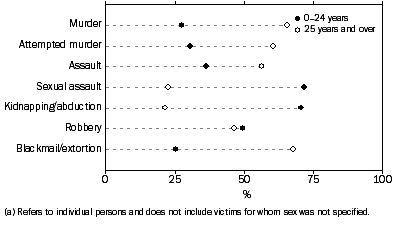
Persons aged 24 years or less comprised the majority of recorded victims of sexual assault (72%) and kidnapping/abduction (71%), and nearly half of victims of robbery (49%). In contrast, this age group comprised less than one in three victims of attempted murder (31%), murder (27%), driving causing death (25%) and blackmail/extortion (25%).
VICTIMS(a), Offence categories by age group
Persons in the 15-19 year and 20-24 year age groups had the highest assault rates (1,600 per 100,000 population). This was more than twice the total assault victimisation rate, and has been the same since 1995.
The victimisation rates displayed further variation across certain offence categories when classified by age and sex. For sexual assault, males aged 14 years and under had the highest victimisation rate (89 per 100,000 population) of any male age group and their rate was nearly three times that of the general male population. For females the highest sexual assault victimisation rate was for the 10-19 year age group (497 per 100,000 population), over three times the rate for the general female population.
Persons aged 15-19 years were three and a half times more likely to be victims of robbery than the general population. The victimisation rate for robbery was the highest in the 20-24 year age group for females (117 per 100,000 population) but highest in the 15-19 year age group for males (468 per 100,000 population).
Relationship of offender to victim
Approximately half of the victims of murder, attempted murder, assault and sexual assault knew their offender. For sexual assault, the victim was four times more likely to know the offender than not. A higher proportion of female than male victims had a family member as their offender for the offences of murder, attempted murder and assault. For sexual assaults the proportion of victims with a family member offender was similar for males and females, at around 29%.
LOCATION OF OFFENCE
For murder, attempted murder, assault and sexual assault, the victim was most likely to have been subjected to the offence in a residential location. This was especially the case for victims of sexual assault where two in three victims were sexually assaulted in a residential location. More than three in five victims of kidnapping/abduction were taken from a community location, with more than one in four taken from a residential location.
VICTIMS(a), Offences occurring at residential and community locations
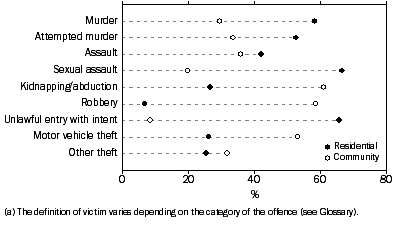
For unlawful entry with intent, the location was most likely to be a residential location (66%), while for robbery and motor vehicle theft more than half of the victims were subjected to an offence in a community location. For those offences which occurred in a community location, a street/footpath was the most frequent location for each offence type, with the exception of sexual assault and unlawful entry with intent.
OUTCOME OF INVESTIGATION
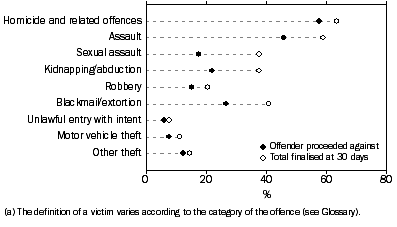
At 30 days after an offence became known to police in 2003, over half of the investigations into manslaughter (69%), attempted murder (68%), murder (64%) and assault (59%) had been finalised. The offences with the lowest proportion of finalisations at 30 days were unlawful entry with intent (8%), motor vehicle theft (11%), other theft (15%) and robbery (21%).
Of those investigations finalised, police were most likely to have proceeded against an offender at 30 days for homicide and related offences: driving causing death (95%), attempted murder (92%), manslaughter (89%) and murder (87%). Offences involving unlawful entry with intent, motor vehicle theft and other theft had a low proportion of finalisations at 30 days, but of those that were finalised, a high proportion were proceeded against by police - unlawful entry with intent (78%), motor vehicle theft (71%) and other theft (85%). The offence categories which had the highest proportion of investigations finalised where there was no offender proceeded against included sexual assault (53%) and kidnapping/abduction (41%).
VICTIMS(a), Outcome of investigation at 30 days
WEAPON USE
A weapon was most likely to have been used in attempted murder (76%) and murder (58%), and least likely in sexual assault (1%) in 2003. The proportion of murders involving a weapon peaked in 1996 at 78% while the proportion of attempted murders involving a weapon peaked in 1997 at 87%. The proportion of assault offences involving a weapon increased from 10% in 1995 to 13% in 2003.
VICTIMS(a), Weapon used in commission of offence
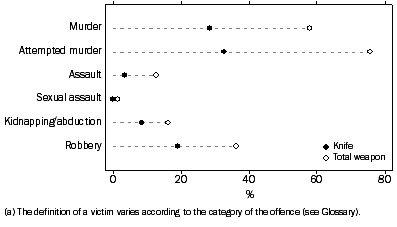
A weapon was used in 36% of robberies recorded in 2003. The proportion of robberies in which a weapon was used increased from 36% in 1994 to 46% in 1998 and has since generally declined. For those robberies that involved a weapon, the proportion involving a firearm decreased from 36% in 1994 to 15% in 2003. The proportion of kidnapping/abduction where a weapon was used also fluctuated from 11% in 1995 to 24% in 1999. Since 1999, this proportion has declined to 16% in 2003.
With the exception of assault, a knife was the most common type of weapon used and was involved in 33% of attempted murders, 28% of murders and 19% of robberies. A firearm was involved in 20% of attempted murders, 13% of murders and 6% of robberies.
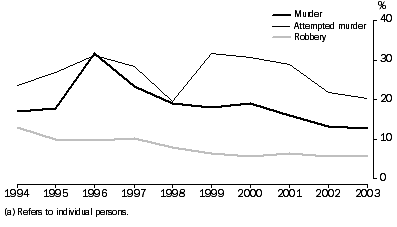
A firearm was used in 6% of robberies recorded in 2003, the equal lowest proportion since national reporting began in 1993. The proportion of murders involving a firearm in 2003 was also at its lowest on record at 13%. Firearm use in murders peaked at 32% in 1996, but has since declined steadily. For attempted murders in 2003, a firearm was used in 20% of offences, marginally above its low of 19% in 1998 and well below its high of 32% in 1999.
VICTIMS(a), Firearm used in commission of offence
STATE/TERRITORY COMPARISONS
Overall the number of victims recorded by Australian police declined in most offence categories in 2003. The victimisation rates (per 100,000 population), which provide a meaningful basis for comparing differences between the states and territories, indicate:
- Unlawful entry with intent victimisation rates decreased in every state and territory between 2002 and 2003. The states and territories to record the largest decreases included the Northern Territory (26%) and Victoria (16%).
- Most states and territories recorded a decrease in victimisation rates for motor vehicle theft between 2002 and 2003. The largest decreases were recorded in Victoria (19%) and New South Wales (17%). The Australian Capital Territory recorded a substantial increase of 24%.
- The victimisation rate for robbery decreased in all but two states and territories between 2002 and 2003. The largest decreases were in South Australia (19%), Northern Territory (16%) and Victoria (11%). The only states to record increases were Queensland and Western Australia, where the robbery victimisation rates increased by 4% for both states.
- The victimisation rate for assault in 2003 decreased for all states and territories except Northern Territory and Tasmania. Northern Territory recorded an increase of 7% to 1,874 per 100,000 population and Tasmania recorded an increase of 2% to 785 per 100,000 population.
- The Australian Capital Territory recorded the largest decrease in sexual assault victimisation rate at 32%, followed by Western Australia which recorded a 23% decrease. In contrast, South Australia recorded the largest increase in the sexual assault victimisation rate in 2003 at 13%.
TABLE 1 VICTIMS(a), By Offence Category—2003
|  |
 |  | NSW | Vic. | Qld | SA | WA | Tas. | NT | ACT | Aust. |  |
|  |
NUMBER |  |
|  |
| Homicide and related offences | 356 | 171 | 231 | 79 | 64 | 11 | 18 | 8 | 938 |  |
 | Murder | 102 | 71 | 65 | 19 | 26 | 4 | 11 | 4 | 302 |  |
 | Attempted murder | 121 | 51 | 116 | 40 | 16 | 6 | – | 2 | 352 |  |
 | Manslaughter | 11 | 5 | 5 | 1 | 9 | – | 7 | 1 | 39 |  |
 | Driving causing death | 122 | 44 | 45 | 19 | 13 | 1 | – | 1 | 245 |  |
| Assault | 79 892 | 17 140 | 21 140 | 16 006 | 15 056 | 3 745 | 3 664 | 1 986 | 158 629 |  |
| Sexual assault | 6 796 | 2 565 | 5 069 | 1 852 | 1 268 | 257 | 303 | 127 | 18 237 |  |
| Kidnapping/abduction | 423 | 93 | 125 | 34 | 34 | 2 | 2 | 3 | 716 |  |
| Robbery | 10 847 | 2 875 | 2 177 | 1 321 | 2 081 | 135 | 83 | 200 | 19 719 |  |
 | Armed Robbery | 3 318 | 1 404 | 966 | 530 | 776 | 72 | 29 | 67 | 7 162 |  |
 | Unarmed Robbery | 7 529 | 1 471 | 1 211 | 791 | 1 305 | 63 | 54 | 133 | 12 557 |  |
| Blackmail/extortion | 80 | 108 | 71 | 61 | 45 | 4 | – | 1 | 370 |  |
| Unlawful entry with intent | 128 488 | 60 612 | 63 148 | 28 513 | 56 611 | 6 554 | 4 204 | 5 289 | 353 419 |  |
 | UEWI-Involving the taking of property | 98 791 | 45 848 | 47 571 | 18 379 | 38 064 | 5 156 | 2 601 | 4 620 | 261 030 |  |
 | UEWI-Other | 29 697 | 14 764 | 15 577 | 10 134 | 18 547 | 1 398 | 1 603 | 669 | 92 389 |  |
| Motor vehicle theft | 34 824 | 23 823 | 13 930 | 10 206 | 10 628 | 2 150 | 702 | 2 550 | 98 813 |  |
| Other theft | 194 006 | 136 417 | 113 997 | 73 759 | 91 138 | 12 064 | 6 717 | 10 870 | 638 968 |  |
|  |
RATE PER 100,000 PERSONS |  |
|  |
| Homicide and related offences | 5.3 | 3.5 | 6.1 | 5.2 | 3.3 | 2.3 | 9.1 | np | 4.7 |  |
 | Murder | 1.5 | 1.4 | 1.7 | 1.2 | 1.3 | np | 5.5 | np | 1.5 |  |
 | Attempted murder | 1.8 | 1.0 | 3.1 | 2.6 | 0.8 | np | – | np | 1.8 |  |
 | Manslaughter | 0.2 | np | np | np | np | – | np | np | 0.2 |  |
 | Driving causing death | 1.8 | 0.9 | 1.2 | 1.2 | 0.7 | np | – | np | 1.2 |  |
| Assault | 1 194.8 | 348.6 | 556.8 | 1 047.9 | 771.2 | 785.0 | 1 847.2 | 615.1 | 798.0 |  |
| Sexual assault | 101.6 | 52.2 | 133.5 | 121.3 | 64.9 | 53.9 | 152.8 | 39.3 | 91.7 |  |
| Kidnapping/abduction | 6.3 | 1.9 | 3.3 | 2.2 | 1.7 | np | np | np | 3.6 |  |
| Robbery | 162.2 | 58.5 | 57.3 | 86.5 | 106.6 | 28.3 | 41.8 | 61.9 | 99.2 |  |
 | Armed Robbery | 49.6 | 28.6 | 25.4 | 34.7 | 39.7 | 15.1 | 14.6 | 20.8 | 36.0 |  |
 | Unarmed Robbery | 112.6 | 29.9 | 31.9 | 51.8 | 66.8 | 13.2 | 27.2 | 41.2 | 63.2 |  |
| Blackmail/extortion | 1.2 | 2.2 | 1.9 | 4.0 | 2.3 | np | – | np | 1.9 |  |
| Unlawful entry with intent | 1 921.6 | 1 232.6 | 1 663.2 | 1 866.7 | 2 899.7 | 1 373.7 | 2 119.5 | 1 638.2 | 1 777.9 |  |
 | UEWI-Involving the taking of property | 1 477.4 | 932.4 | 1 252.9 | 1 203.3 | 1 949.7 | 1 080.7 | 1 311.3 | 1 431.0 | 1 313.1 |  |
 | UEWI-Other | 444.1 | 300.2 | 410.3 | 663.5 | 950.0 | 293.0 | 808.2 | 207.2 | 464.8 |  |
| Motor vehicle theft | 520.8 | 484.5 | 366.9 | 668.2 | 544.4 | 450.6 | 353.9 | 789.8 | 497.1 |  |
| Other theft | 2 901.4 | 2 774.2 | 3 002.5 | 4 829.0 | 4 668.3 | 2 528.6 | 3 386.4 | 3 366.9 | 3 214.3 |  |
|  |
| - nil or rounded to zero (including null cells). |  |
| np not available for publication but included in totals where applicable, unless otherwise indicated. |  |
| (a) The definition of a victim varies according to the category of the offence (see Glossary). |  |
TABLE 2 VICTIMS(a), By Offence Category—2003 compared with 2002(b)
|  |
 |  | NSW | Vic. | Qld | SA | WA | Tas. | NT | ACT | Aust. |  |
|  |
% CHANGE IN NUMBER (c) |  |
|  |
| Homicide and related offences | 5.3 | –6.0 | –4.9 | –2.5 | –28.1 | – | –40.0 | np | –4.2 |  |
 | Murder | 4.1 | 6.0 | 10.2 | –34.5 | –35.0 | np | –26.7 | np | –4.7 |  |
 | Attempted murder | –17.7 | –3.8 | –9.4 | 2.6 | –20.0 | np | np | np | –12.0 |  |
 | Manslaughter | –15.4 | np | np | np | – | – | np | np | –18.8 |  |
 | Driving causing death | 52.5 | –22.8 | 18.4 | 46.2 | –43.5 | np | – | np | 14.5 |  |
| Assault | –0.2 | –6.6 | 1.4 | –3.2 | –1.5 | 2.8 | 6.8 | –0.1 | –0.9 |  |
| Sexual assault | 4.9 | –4.6 | 5.7 | 14.0 | –21.7 | 2.8 | –8.5 | –31.4 | 1.5 |  |
| Kidnapping/abduction | –3.0 | –12.3 | 66.7 | 9.7 | –5.6 | np | np | np | 1.4 |  |
| Robbery | –7.3 | –10.2 | 6.4 | –18.6 | 5.7 | –0.7 | –16.2 | –5.2 | –6.1 |  |
 | Armed Robbery | –13.0 | –11.3 | 9.0 | 1.7 | –14.7 | 38.5 | –21.6 | 86.1 | –8.7 |  |
 | Unarmed Robbery | –4.6 | –9.1 | 4.4 | –28.2 | 23.2 | –25.0 | –12.9 | –24.0 | –4.5 |  |
| Blackmail/extortion | –2.4 | –12.9 | 24.6 | — | 45.2 | np | np | np | 3.9 |  |
| Unlawful entry with intent | –9.0 | –14.8 | –7.5 | –13.7 | –7.9 | –11.6 | –25.8 | –13.6 | –10.4 |  |
 | UEWI-Involving the taking of property | –9.6 | –14.5 | –7.9 | –15.6 | –8.7 | –11.8 | –27.0 | –12.5 | –10.8 |  |
 | UEWI-Other | –6.8 | –15.9 | –6.1 | –10.2 | –6.2 | –10.7 | –23.9 | –20.4 | –9.0 |  |
| Motor vehicle theft | –16.4 | –17.5 | –12.1 | –9.0 | 1.3 | –13.5 | –13.1 | 24.0 | –12.9 |  |
| Other theft | –8.5 | –4.3 | –2.6 | –6.9 | –7.2 | –10.9 | –17.6 | 6.5 | –6.1 |  |
|  |
% CHANGE IN RATE PER 100,000 PERSONS (d) |  |
|  |
| Homicide and related offences | 4.5 | –7.2 | –7.1 | –3.0 | –29.1 | –0.9 | –39.9 | np | –5.4 |  |
 | Murder | 3.3 | 4.7 | 7.7 | –34.9 | –35.9 | np | –26.6 | np | –5.9 |  |
 | Attempted murder | –18.3 | –5.0 | –11.4 | 2.0 | –21.1 | np | np | np | –13.1 |  |
 | Manslaughter | –16.1 | np | np | np | – | – | np | np | –19.7 |  |
 | Driving causing death | 51.3 | –23.8 | 15.7 | 45.3 | –44.3 | np | – | np | 13.1 |  |
| Assault | –1.0 | –7.8 | –0.9 | –3.8 | –2.9 | 1.8 | 7.0 | –0.5 | –2.1 |  |
| Sexual assault | 4.1 | –5.8 | 3.3 | 13.3 | –22.8 | 1.8 | –8.3 | –31.6 | 0.2 |  |
| Kidnapping/abduction | –3.7 | –13.3 | 62.9 | 9.1 | –6.9 | np | np | np | 0.2 |  |
| Robbery | –8.1 | –11.3 | 4.0 | –19.1 | 4.2 | –1.7 | –16.0 | –5.6 | –7.2 |  |
 | Armed Robbery | –13.7 | –12.4 | 6.6 | 1.2 | –15.9 | 37.2 | –21.5 | 85.3 | –9.8 |  |
 | Unarmed Robbery | –5.3 | –10.2 | 2.0 | –28.6 | 21.5 | –25.7 | –12.8 | –24.3 | –5.7 |  |
| Blackmail/extortion | –3.2 | –14.0 | 21.8 | –0.6 | 43.1 | – | – | – | 2.7 |  |
| Unlawful entry with intent | –9.7 | –15.9 | –9.6 | –14.2 | –9.2 | –12.4 | –25.7 | –13.9 | –11.5 |  |
 | UEWI-Involving the taking of property | –10.3 | –15.6 | –10.0 | –16.1 | –10.0 | –12.6 | –26.9 | –12.9 | –11.9 |  |
 | UEWI-Other | –7.5 | –16.9 | –8.3 | –10.7 | –7.6 | –11.6 | –23.7 | –20.7 | –10.1 |  |
| Motor vehicle theft | –17.1 | –18.6 | –14.1 | –9.5 | –0.1 | –14.3 | –13.0 | 23.5 | –14.0 |  |
| Other theft | –9.2 | –5.5 | –4.8 | –7.4 | –8.6 | –11.7 | –17.5 | 6.1 | –7.3 |  |
|  |
- nil or rounded to zero (including null cells).
na not available. |  |
| np not available for publication but included in totals where applicable, unless otherwise indicated. |  |
(a) The definition of a victim varies according to the category of the offence (see Glossary).
(b) Data and ERP for 2002 have been revised (see Explanatory Notes paragraphs 20 and 21).
(c) Percentage change figures are subject to rounding.
(d) Estimates of percentage change movements are obtained by taking the difference of unrounded rates. The movement is then rounded to one decimal place. Where a discrepancy occurs between the published percentage change and the difference in rounded rates, the published change is more accurate. |  |
|
 Print Page
 Print All