JUNE KEY FIGURES
 | | Jun Qtr 14 | Mar Qtr 14 to Jun Qtr 14 | Jun Qtr 13 to Jun Qtr 14 |
| | $m | % change | % change |
|
| Trend estimates(a) | | | |
| Total new capital expenditure | 37 408 | -1.7 | -5.0 |
| Buildings and structures | 25 223 | -1.9 | -2.1 |
| Equipment, plant and machinery | 12 218 | -1.1 | -10.4 |
| Seasonally adjusted(a) | | | |
| Total new capital expenditure | 37 646 | 1.1 | -4.0 |
| Buildings and structures | 25 293 | 2.0 | -0.7 |
| Equipment, plant and machinery | 12 352 | -0.9 | -10.1 |
|
| (a) In volume terms |
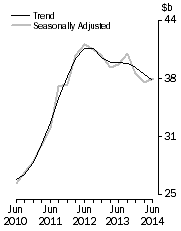
New Capital Expenditure, in Volume terms
| |
JUNE KEY POINTS
ACTUAL EXPENDITURE (VOLUME TERMS)
- The trend volume estimate for total new capital expenditure decreased by 1.7% in the June quarter 2014 while the seasonally adjusted estimate increased by 1.1%.
- The trend volume estimate for buildings and structures decreased by 1.9% in the June quarter 2014 while the seasonally adjusted estimate increased by 2.0%.
- The trend volume estimate for equipment, plant and machinery decreased by 1.1% in the June quarter 2014 while the seasonally adjusted estimate decreased by 0.9%.
EXPECTED EXPENDITURE (CURRENT PRICE TERMS)
- This issue includes the seventh estimate (Estimate 7) for 2013-14 and the third estimate (Estimate 3) for 2014-15.
- Estimate 7 for 2013-14 is $157,869m. This is 1.7% lower than Estimate 7 for 2012-13. Estimate 7 is 3.2% lower than Estimate 6 for 2013-14.
- Estimate 3 for 2014-15 is $145,158m. This is 10.2% lower than Estimate 3 for 2013-14.
- See pages 7 to 10 for further commentary on expectations data.
NOTES
FORTHCOMING ISSUES
| ISSUE (QUARTER) | Release Date |
| September 2014 | 27 November 2014 |
| December 2014 | 26 February 2015 |
| March 2015 | 28 May 2015 |
| June 2015 | 27 August 2015 |
CHANGES TO NEXT ISSUE
- As happens in September quarter each year, revisions to previously released data will occur as a result of the annual re-analysis of seasonally adjusted data series and the movement forward on the index year for the calculation of chain volume measures.
CHANGES TO THIS ISSUE
- The March quarter 2014 estimate for total capital expenditure has been revised upwards by $281m (+0.8%). Buildings and structures was revised upwards by $288m (+1.3%) and equipment, plant and machinery was revised downwards by $8m (-0.1%). The revisions are due to updated information received from survey respondents.
- Revisions to seasonally adjusted estimates are due to revisions to original estimates as well as concurrent methodology for deriving seasonal factors.
INQUIRIES
For further information about these and related statistics, contact the National Information and Referral Service on 1300 135 070 or Mark Wicht on Sydney (02) 9268 4332.
 Quality Declaration
  Print Page
 Print All