NOTES
ABOUT THIS PUBLICATION
This publication presents a summary of results from the Survey of Disability, Ageing and Carers (SDAC) conducted by the Australian Bureau of Statistics (ABS) throughout Australia, from June to November 2003. The primary objective of the survey was to collect information about three population groups:
- people with a disability
- older people (i.e. those aged 60 years and over)
- people who provide assistance to older people and people with disabilities.
The SDAC was also conducted in 1998 and this publication presents some comparisons with this survey. The 2003 SDAC was largely a repeat of the 1998 survey, with some additions to content in the areas of cognitive and emotional support, and computer and Internet use. Comparisons with previous disability surveys are also possible. For further information, see paragraph 53 of the Explanatory notes.
Preliminary results relating to disability were released in May 2004 in Disability, Australia: Preliminary, 2003 (cat. no. 4446.0). Since the release of the preliminary publication further processing of the data has been undertaken. This publication presents final data. Further tables from the 2003 SDAC will be released via the ABS web site.
ROUNDING
As estimates have been rounded, discrepancies may occur between sums of the component items and totals.
INQUIRIES
For further information about these and related statistics, contact the National Information and Referral Service on 1300 135 070 or Ken Black on Canberra (02) 6252 7430.
SUMMARY OF FINDINGS
OVERVIEW
Disability
In the 2003 Australian Bureau of Statistics (ABS) Survey of Disability, Ageing and Carers (SDAC) one in five people in Australia (3,958,300 or 20.0%) had a reported disability. This rate was much the same for males (19.8%) and females (20.1%). Disability was defined as any limitation, restriction or impairment, which has lasted, or is likely to last, for at least six months and restricts everyday activities. Examples range from hearing loss which requires the use of a hearing aid, to difficulty dressing due to arthritis, to advanced dementia requiring constant help and supervision.
After removing the effects of different age structures there was little change in the disability rate between 1998 (20.1%) and 2003 (20.0%). The rate of profound or severe core-activity limitation also showed little change between 1998 (6.4%) and 2003 (6.3%).
Of persons aged 15-64 years with a reported disability living in households, 30% had completed year 12 and 13% had completed a bachelor degree or higher. Of those with no disability the respective proportions were 49% and 20%. The labour force participation rate of persons with a disability was 53% and the unemployment rate was 8.6%. Corresponding rates for those without a disability were 81% and 5.0%. The median gross personal income per week of persons aged 15-64 years with a reported disability living in households was $255, compared to $501 for those without a disability. Median gross personal income per week decreased with increasing severity of disability. It was lowest ($200 per week) for those with a profound core-activity limitation.
Older people
In 2003, there were 3.35 million people aged 60 years and over (17% of the population), which compares to 3.0 million people (16%) in 1998. In 2003, just over half had a reported disability (51%) and 19% had a profound or severe core-activity limitation.
Of all people aged 60 years and over, less than half (41%) reported needing assistance, because of disability or old age, to manage health conditions or cope with everyday activities. However, people aged 85 years and over reported a much higher need for assistance than those aged 60-69 years (84% compared with 26%).
Carers
In 2003, there were 2.6 million carers who provided some assistance to those who needed help because of disability or age. About one fifth of these (19%) were primary carers, that is people who provided the majority of the informal help needed by a person with a disability. Just over half (54%) of all carers were women. Women were also more likely (71%) to be primary carers. Of those providing care, 1.0 million (39%) were in the 35-54 year age range. This age group's caring responsibilities involved children, partners and/or ageing parents.
Those who provided care to people with a disability were more likely to be older and/or have a disability than those who did not provide care. Twenty-four per cent of primary carers were aged 65 years and over, compared to 13% of the total population. Of those living in households, the disability rates were 40% for primary carers, 35% for all carers and 20% for non-carers.
DISABILITY
One in five people in Australia (3,958,300 or 20%) had a reported disability in 2003. A further 4,149,000 (21%) had a long-term health condition that did not restrict their everyday activities. The remaining 11,703,800 (59%) had neither a disability nor a long term health condition.
Of those with a reported disability, 86% (3,387,900) were limited in the core activities of self care, mobility or communication, or restricted in schooling or employment. Most people with a disability (76%) were limited in one or more of these core activities.
Sex and age
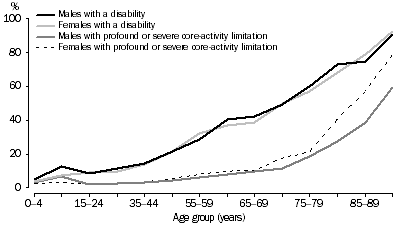
The disability rate increased with age, reaching 92% for those aged 90 years and over. The pattern of prevalence of profound or severe core-activity limitation gradually increased from 3% for age groups 0-4 years through to 10% for 65-69 years but it then increased sharply to 74% for those aged 90 years and over. This contrasted with the overall disability rate which increased steadily from 4% of 0-4 year olds to 41% of 65-69 year olds and 92% of those aged 90 years and over.
Rates of disability and profound or severe core-activity limitation for 5-14 year old males (12.4% and 6.5% respectively) were almost double those for 5-14 year old females (7.5% and 3.3% respectively). In contrast, females aged 80 years and over had a much higher rate of profound or severe core-activity limitation (52%) than males of the same age (34%).
ALL PERSONS, Disability rates by age and sex, 2003
Education and employment
In 2003, one in four people (24%) aged 15-64 years with a profound or severe core-activity limitation, who were living in households, had completed Year 12. This compares to half (49%) of those without a disability. People with a profound or severe core-activity limitation were less likely to have completed a diploma or higher qualification (14%) than those without a disability (28%).
Employment-related findings, for people aged 15-64 years living in households, from the 2003 SDAC include:
- those with a profound level of core-activity limitation had a much lower labour force participation rate (15%) than people without a disability (81%)
- people with a disability who were employed were more likely to work part-time (37%) than those who were employed and did not have a disability (29%)
- people employed in Agriculture, forestry and fishing (16%) had a relatively high disability rate compared to the overall rate for those employed (11%).
Health conditions
Physical conditions were the most common main health conditions of persons with a disability (84%). The remaining 16% had a mental or behavioural disorder as their main condition. However, those whose main condition was a mental or behavioural disorder were more likely to have a profound or severe core-activity limitation than those with a physical condition (46% compared to 29%).
Over half (56%) of those with psychoses or mood affective disorders, such as dementia and depression, had a profound or severe core-activity limitation. This compares to 33% for those with circulatory conditions, such as stroke and heart disease, and 33% for those with diseases of the nervous system - the classes of physical conditions with the highest rates of profound or severe core-activity limitation.
PERSONS WITH A DISABILITY, Profound or severe core-activity limitation rates by condition, 2003

Assistance
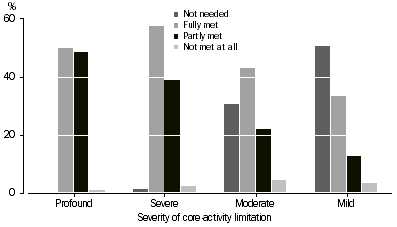
In 2003, 61% of the 3.8 million people with a disability living in households reported needing assistance to manage their health conditions or cope with the activities of everyday life. This proportion comprised 37% who reported that their needs were fully met, 22% partly met and 3% not met at all. The remainder (39%) had a disability but did not need assistance.
Of those with a core-activity limitation, the more severe the limitation the higher the proportion with an unmet need for help. Of those with a profound limitation 50% reported that their needs were only partly met or not met at all. This contrasts with 41% for those with a severe limitation, 26% for those with a moderate limitation and 16% for those with a mild limitation who reported that their needs were partly met or not met at all.
PERSONS WITH A DISABILITY, Whether need for assistance met, 2003
Of people with a disability living in households who needed assistance, 79% received help from relatives and friends, mainly partners, parents or children. Formal providers of assistance, such as home-care workers and voluntary workers, were used by just over half of those with a disability (53%).
Other findings on disability
Among the other findings on disability from the SDAC are that:
- one in 10 people in Australia used equipment or an aid to help them cope with their condition or manage with their everyday life
- 15.2% (600 300) of people with a disability reported that the cause of their main health condition was accident or injury, 14% (557 300) that it was disease, illness or heredity, and 11% (423,500) that it was 'Working conditions, work or over-work'
- comparing the states and territories using data which have been adjusted to account for differences in age structures, South Australia, Tasmania and Queensland had the highest disability rates (23%), while the Australian Capital Territory had the lowest (16%).
OLDER PEOPLE
There were 3.35 million people aged 60 years and over in 2003. The vast majority lived in private dwellings (91%) in both 1998 and 2003. However, of those living in non-private dwellings 55% lived in cared accommodation in 2003, while 78% lived in cared accommodation in 1998. The remaining 45% in 2003, and 22% in 1998, lived in 'other non-private dwellings', such as self-care units in retirement villages etc. (see Glossary).
The number of people aged 60 years and over with a disability living in 'other non-private dwellings' more than doubled in 2003 compared to 1998. There were 122,700 people aged 60 years and over living in 'other non-private dwellings' in 2003, of which 82,900 (68%) had a disability. Corresponding results from the 1998 SDAC were 57,600 people living in 'other non-private dwellings', of which 31 680 (55%) had a disability.
Need for assistance
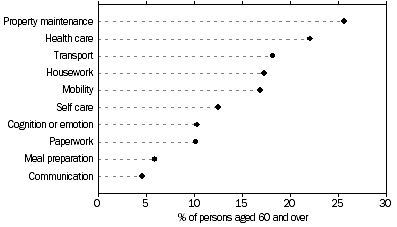
Older people living in households most commonly reported needing assistance with property maintenance and health care because of disability or age. Other common areas of need were transport, housework, mobility and self care. Family and friends were the main providers of assistance although 61% received formal help from providers such as doctors, nurses and gardeners. Partners, sons and daughters were the most common providers of help to older people. Of the 959,400 receiving informal assistance, 452,900 (47%) were assisted by partners, who were likely to be older themselves. Of those providing primary care for their partner, 48% were aged 65 years and older.
OLDER PEOPLE, Activities for which assistance needed, 2003
Income
A 'Government pension or allowance' was the main source of personal income for about half (52%) of people aged 60 years and over living in households without a disability and three-quarters (74%) of those with a disability. This proportion was higher (87%) for those with a profound core-activity limitation. Corresponding proportions for 'Wages or salary, own unincorporated business income' were 20% (without a disability), 7% (with a disability) and 1% (with a profound core-activity limitation).
Median gross personal income per week from all sources was highest ($650) for those where the main source was 'Wages or salary, own unincorporated business income'. For those where the main source was 'Superannuation or annuity, dividends or interest, other private income' it was $451, and for those where the main source was a 'Government pension or allowance' it was $206. Among whose main source was 'Wages or salary, own unincorporated business income', the median income from all sources for those with a disability ($538), was lower than for those without ($672).
CARERS
In 2003, 2,557,000 people (13% of people living in households) were carers who provided some assistance to those who needed help because of disability or age. About one in five carers (474,600), were identified as primary carers who provided the majority of informal help to a person with a disability. Most primary carers (78%) cared for a person living in the same household.
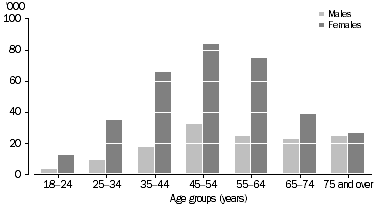
The majority of primary carers were female (71%), although the difference between the sexes was less pronounced for those aged 65 years and over (58% female). The 45-54 years age group contained the largest number of both male and female primary carers (32,200 and 83,400 respectively).
PERSONS LIVING IN HOUSEHOLDS, Primary carers by sex, 2003
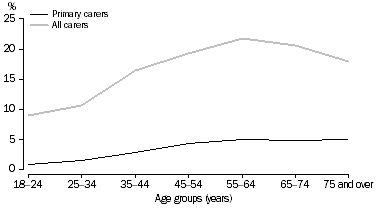
In 2003, the percentage of people living in households that were identified as carers increased gradually with age from 9% of 18-24 year olds to 22% of 55-64 year olds, then declined to 18% of those aged 75 years and over, although this was 5 percentage points higher than the overall rate of 13%.
The proportion of people who were primary carers also increased gradually with age, from 1% of 18-24 year olds to 5% of 55-64 year olds. Unlike the overall carer rate though, it did not decrease for the older age groups, staying at 5%.
PERSONS LIVING IN HOUSEHOLDS, Carers by age, 2003
Other findings on carers included:
- the most common reasons given by primary carers for taking on the caring role were 'Family responsibility', 'Could provide better care' and 'Emotional obligation'
- primary carers had a lower labour force participation rate (39%) than people who were not carers (68%)
- 37% of primary carers spent on average 40 hours or more per week providing care and 18% spent 20 to 39 hours per week.
Further Tables are available from the Survey of Disability, Ageing and Carers, particularly providing additional data on long term health conditions and disability groups Catalogue Number 4430.0.55.001 under the Category of Data Cubes.
Further Tables are available from the Disability, Ageing and Carers, Disability and Long Term Health Conditions, Tables 12 to 19 Catalogue Number 4430.0.55.002 under the Category of Data Cubes.
Further Tables are available from the Disability, Ageing and Carers, Australia: Caring in the Community Catalogue Number 4430.0.55.003 and from Disability, Ageing and Carers, Australia: Caring in the Community, Tables 17 to 24 Catalogue Number 4430.0.55.004 under the Category of Data Cubes.
 Print Page
 Print All