SEPTEMBER KEY TREND FIGURES
LIVESTOCK PRODUCTS, Australia, September 2015
 | Jun 2015 | Sept 2015 | Jun '15 to Sept '15 | Sept '14 to Sept '15 |
|
| Livestock (no.) | | | | |
| Cattle (excluding calves) | 2 310 140 | 2 286 064 | -1.0% | -2.2% |
| Calves | 176 237 | 176 752 | 0.3% | 4.0% |
| Sheep | 2 123 300 | 2 107 192 | -0.8% | -15.4% |
| Lambs | 5 720 144 | 5 731 929 | 0.2% | 2.5% |
| Pigs | 1 239 655 | 1 231 428 | -0.7% | 2.0% |
| Chickens | 148 236 639 | 148 648 075 | 0.3% | 0.9% |
| Livestock products (t) | | | | |
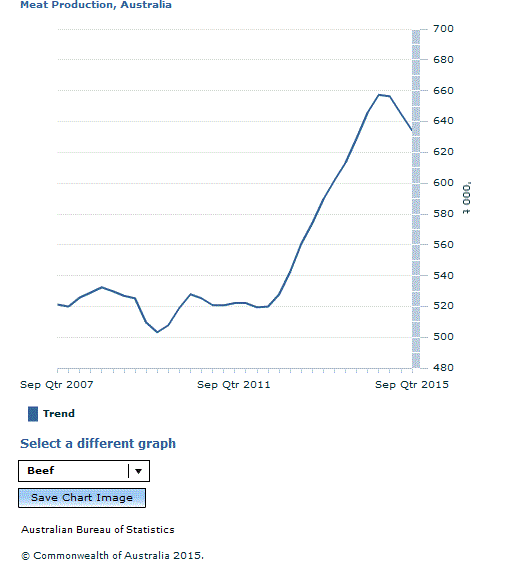
| Beef | 644 970 | 634 340 | -1.7% | -1.8% |
| Veal | 9 070 | 8 573 | -5.5% | -16.6% |
| Mutton | 50 680 | 50 523 | -0.3% | -13.6% |
| Lamb | 126 502 | 126 201 | -0.2% | 2.2% |
| Pig meat | 93 665 | 93 452 | -0.2% | 2.7% |
| Total red meat | 924 886 | 913 089 | -1.3% | -1.7% |
| Chicken meat | 278 997 | 279 280 | 0.1% | 0.6% |
| Brokers and dealers receivals of taxable wool | 92 113 | 91 436 | -0.7% | 4.6% |
KEY POINTS
Livestock slaughtering and meat production quarterly trend movements for September 2015:
- Cattle slaughter and beef production figures continue to decline in September 2015
- Sheep slaughter continued to decline in September 2015 as export demand eases
- Chicken slaughter and meat production figures increased in September 2015
- Wool receivals decreased marginally in September 2015
 Quality Declaration
  Print Page
 Print All