AUGUST KEY FIGURES
 | Trend estimates | Seasonally adjusted estimates |
 | Aug 2009 | Jul 2009 to Aug 2009 | Aug 2009 | Jul 2009 to Aug 2009 |
|
| Value of dwelling commitments(a) | $m | % change | $m | % change |
| Total dwellings | 23 115 | 0.2 | 22 782 | 0.7 |
| Owner occupied housing | 16 965 | -0.2 | 16 543 | -1.7 |
| Investment housing - fixed loans(b) | 6 149 | 1.4 | 6 239 | 7.6 |
| Number of dwelling commitments(a) | no. | % change | no. | % change |
| Owner occupied housing | 63 820 | -0.1 | 62 718 | -0.6 |
| Construction of dwellings | 6 615 | 1.8 | 6 614 | 4.6 |
| Purchase of new dwellings | 2 707 | 0.6 | 2 760 | 4.9 |
| Purchase of established dwellings | 54 499 | -0.4 | 53 344 | -1.5 |
|
| (a) Includes refinancing (see Glossary). |
| (b) Excludes revolving credit. |
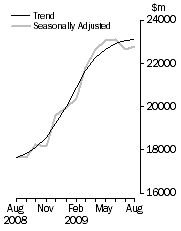
Value of dwelling commitments, Total dwellings

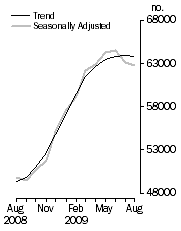
| No. of dwelling commitments, Owner occupied housing

|
AUGUST KEY POINTS
VALUE OF DWELLING COMMITMENTS
August 2009 compared with July 2009:
- In trend terms, the total value of dwelling finance commitments excluding alterations and additions increased 0.2%. Investment housing commitments increased 1.4%, while owner occupied housing commitments decreased 0.2%.
- In seasonally adjusted terms, the total value of dwelling finance commitments excluding alterations and additions increased 0.7%. An increase was recorded in investment housing commitments, up 7.6%, while owner occupied housing commitments fell 1.7%.
NUMBER OF DWELLING COMMITMENTS
August 2009 compared with July 2009:
- In trend terms, the number of commitments for owner occupied housing finance decreased 0.1%.
- In trend terms, the number of commitments for the purchase of established dwellings fell 0.4%, while the number of commitments for the construction of dwellings rose 1.8%.
- In original terms, the number of first home buyer commitments as a percentage of total owner occupied housing finance commitments fell, decreasing from 25.3% in July 2009 to 24.7% in August 2009.
- In original terms, the number of fixed rate loan commitments as a percentage of total owner occupied housing finance commitments decreased from 7.2% in July 2009 to 6.3% in August 2009.
NOTES
FORTHCOMING ISSUES
| ISSUE | Release Date |
| September 2009 | 9 November 2009 |
| October 2009 | 9 December 2009 |
| November 2009 | 12 January 2010 |
| December 2009 | 10 February 2010 |
| January 2010 | 10 March 2010 |
| February 2010 | 12 April 2010 |
REVISIONS
Revisions were made to the original series from May 2009 to July 2009. Seasonally adjusted and trend series have been revised as a result of revisions to the original series and the incorporation of estimates for the latest month.
INQUIRIES
For further information about these and related statistics, contact the National Information and Referral Service on 1300 135 070 or Philip Beresford on Canberra (02) 6252 6052.
 Quality Declaration
  Print Page
 Print All