|
|
03/04/2008 Note: The graph ('Number of Crime Victims by offence for selected offences and selected years') was incorrectly labelled and has been replaced.
Education News - ABS Education Services
This newsletter highlights the latest curriculum related teaching resources, student activities and statistical tools that have been developed by ABS Education Services as well as other ABS resources that are useful for schools.
Contents
- Census 2006 - Community Profiles
- Election Special
- Australian Social Trends, 2007
- An Idea for the Classroom
- Conference Participation
- CensusAtSchool 2008
- Recently Released Publications
Census 2006 - Community Profiles
 Community Profiles bring together tables of Census data for chosen locations. The Basic Community Profile includes 45 tables of demographic information including age, ancestry, income, education and more. The Expanded Community Profile provides further data on key census characteristics. The Indigenous Profile includes tables of key census characteristics of Aboriginal and Torres Strait Islander persons, families and dwellings and includes comparisons with non-indigenous persons. These three profiles are based on place of usual residence1 for 2006. The Place of Enumeration Profile presents basic demographic data similar to the Basic Community Profile but based on place of enumeration2. This allows comparisons with previous census community profiles. The Time Series Profile includes tables similar to the Basic Community Profile and compares data from the 1996, 2001 and 2006 censuses. It is also based on 'place of enumeration'.
| How to access Community Profiles. |
- Go to the ABS Census home page (www.abs.gov.au/census).
- Choose Community Profiles
- You will be asked to enter a place name or postal area. Enter the name of the location and press Search. A list of all areas that include that name will be displayed. (You can also use the Address Search, States and Cities, Browse or Map functions to search for a location.)
- Highlight the appropriate one. A map will be displayed. Check that it is the correct area.
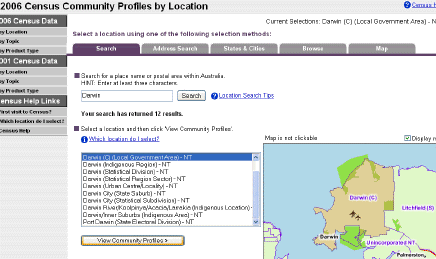
- Press View Community Profiles.
- Choose the relevant Profile (Basic, Expanded, Indigenous, Time Series or Place of Enumeration.) The number of profiles available will vary with the location.
- Choose the appropriate 'Free download'
- The Profile opens on a contents page that lists all of the tables in that Profile.
The example below shows Table 2 from the Time Series Profile for Darwin (LGA).
|
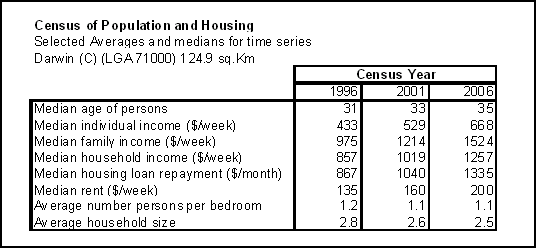
Community Profiles are particularly useful for local area studies.
1. Place of usual residence is the place a person usually lives. It may or may not be the place where the person was counted on Census night.
2. Place of enumeration is the place where a person is counted i.e. where he/she spent Census Night. This may not be where he/she usually lives. |
Election special!
If you are interested in exploring the socio-economic characteristics of an electorate then a quick stop at the Census 2006 data will be useful. Both State and Commonwealth Electoral Divisions (2004 and 2007) are available as options to search for 2006 Census data. Choose the electoral division required and the preferred product. Geographers may be most interested in MapStats, which display a thematic map of the electorate.
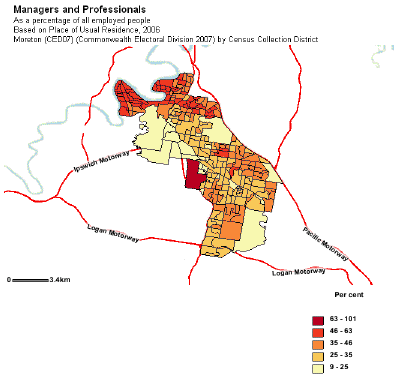
For a deeper understanding of patterns within an electorate, why not overlay a graph of the results from each booth in the area. These are published on the Australian Electoral Commission website at www.aec.gov.au. Topics for 2007 electoral boundaries in MapStats format include educational attainment, employment, hours worked, labour force participation, migration-internal, occupation and transport access and use. QuickStats provide numerical data for the electorate about persons, families and dwellings benchmarked against Australian values. Census Tables for electoral divisions are delivered as Excel spreadsheets and include a wider variety of topics than MapStats.
To view these census products go to www.abs.gov.au/census.
Australian Social Trends, 2007 (cat. no. 4102.0)
Australian Social Trends, 2007 (AST) was released in August and many schools have ordered copies. AST presents statistical analysis and commentary on a wide range of current social issues. Articles are organised into eight chapters: population; family and community; health; education and training; work; economic resources; housing, and other areas of social concern.
 The chapter entitled 'Training for a Trade' is a valuable resource for Careers Teachers. It discusses trends in apprenticeships and training, training rates, pathways to training and characteristics of apprentices among other things. As well as the hard copy publication (check with your librarian), AST is also available for free download from the web site. (For greater convenience, you can open and download just the chapter in which you are interested.) The chapter entitled 'Training for a Trade' is a valuable resource for Careers Teachers. It discusses trends in apprenticeships and training, training rates, pathways to training and characteristics of apprentices among other things. As well as the hard copy publication (check with your librarian), AST is also available for free download from the web site. (For greater convenience, you can open and download just the chapter in which you are interested.)
AST is a useful resource across many curriculum areas. It provides an overview of social change over the past decade, how social conditions vary across Australian States and Territories and also how Australia compares with 17 other nations on certain social indicators.
The style of the report is clear, focused and easy to read. Effective use is made of summary tables and graphics to highlight key information. This annual series builds up over time to provide an invaluable historical perspective of social change in Australia.
An Idea for the Classroom
Are Crime Rates Changing? An Engaging Lesson for the Maths or SOSE/HSIE classroom.
Another of the 'Real Data' Datasets on the Education pages, is Crime Victims, by Offence Category, 1996–2005. Begin with a newspaper article that focuses on crime rates, and ask your class to examine how statistics have been used to support the argument. Sometimes statistics are used appropriately and enhance the argument, but sometimes they are not used correctly and can therefore mislead. Ask students to examine the numbers presented - where have they come from? What other conclusions could be drawn from them? What further information would assist? What assumptions underlie the conclusions?
Ask the students to consider the graph below (produced from the dataset Crime Victims). What does it tell them? What further information would they need to examine whether crime rates are changing? What else might explain the changes between years? Look at the Dataset (MS Excel document 18 KB) . What further information is available from these? Has the extra information changed their original thoughts?

Return to the newspaper/magazine article and reassess what other explanations there may be for the data. Ask your students where they might find that further information.
Do you have a classroom idea that uses ABS data or ABS Education products? Let us know at education@abs.gov.au and we can share it around Australia.
Conference Participation
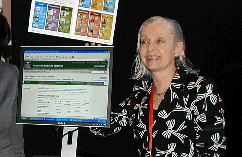 ABS Education Services was represented at the Australian School Librarians' Biennial Conference in Adelaide in October. Thanks to Heather Burns, Kate Hoffmann and Pam Balfour who spoke to many teacher librarians over the three days. Delegates came from all Australian states and territories as well as overseas. They were keen to discover the many ways ABS data can be used in the classroom as well as the education specific resources that ABS provides. ABS Education Services was represented at the Australian School Librarians' Biennial Conference in Adelaide in October. Thanks to Heather Burns, Kate Hoffmann and Pam Balfour who spoke to many teacher librarians over the three days. Delegates came from all Australian states and territories as well as overseas. They were keen to discover the many ways ABS data can be used in the classroom as well as the education specific resources that ABS provides.
Education Services will also be presenting workshops or staffing display stands at Comview, the MAV Conference, the Social Education Victoria conference and the Curriculum Corporation conference during November and December. In January our Geography specialist will be running a workshop at the Biennial Social Educators Australia conference in Newcastle, NSW. We aim to have a presence at as many relevant conferences across the country as possible. This is our chance to not only help you make the most of the ABS, but for us to get direct feedback to improve our service to you. So look for the ABS stand at your next conference and come up and speak to us!
CensusAtSchool 2008
 CensusAtSchool 2008 was launched on 29 October. Over the next few weeks all Australian schools will receive an Information Pack containing the project registration form and all other relevant information detailing how to become involved in 2008. If your school participated in the 2006 project then a new registration form is not required - simply set up new CensusAtSchool teacher Accounts using your School Participation Number (SPN). For more information on registration please visit the How To Get Involved page located on the CensusAtSchool website. CensusAtSchool 2008 was launched on 29 October. Over the next few weeks all Australian schools will receive an Information Pack containing the project registration form and all other relevant information detailing how to become involved in 2008. If your school participated in the 2006 project then a new registration form is not required - simply set up new CensusAtSchool teacher Accounts using your School Participation Number (SPN). For more information on registration please visit the How To Get Involved page located on the CensusAtSchool website.
There will be some exciting new twists for the 2008 project, including a set of common international questions that will allow Australian students to compare their data, to data from New Zealand, United Kingdom and Canada. Following teacher consultations across Australia, there are also some new questions in the 2008 questionnaire, offering even more possibilities for classroom activities.
The Questionnaire Phase begins on 29 January 2008. Students will be able to access the online questionnaire and submit their responses. The Data Usage Phase, where teachers and students can access real, raw and current Australian-wide data, begins on 7 July 2008. You can of course still access CensusAtSchool 2006 data from the random sampler.
Because CensusAtSchool is such a flexible resource, teachers are using it across the curriculum from Grade 5 to Year 12. You can access CensusAtSchool directly from www.abs.gov.au/censusatschool. There is also a free DVD and CD to help you use this invaluable resource. Contact the CensusAtSchool team to receive your copy.
|
|
 |
Recently Released Publications
Household Wealth and Wealth Distribution, Australia, 2005-2006 (cat. no. 6554.0)
Provides estimates of household net worth, or wealth, classified by various characteristics. Also includes summary measures of the distribution of household net worth in Australia. Classifications used to describe households include net worth quintile, income quintile, principal source of household income, family composition, tenure type, and geographic location. For each category of household, estimates of the various assets and liabilities comprising net worth are provided, along with estimates of household income, household size, and other characteristics.
Overseas Arrivals and Departures, Australia, Sep 2007 (cat. no. 3401.0)
Comprises a summary of monthly data by category of movement. For visitors arriving and residents departing short term, the intended length of stay, main purpose of journey, principal destination (departures) or country of usual residence (arrivals) and state and territory in which most time was spent. For settler arrivals - region of birth. |
|
|
 Print Page
 Print All