OCTOBER KEY FIGURES
 | August 2004 | September 2004 | October 2004 | Sep 04 to Oct 04 | |
| $m | $m | $m | % change | |
Trend | |
| |
| Balance on goods & services | -2,075 | -2,114 | -2,162 | . . | |
| Credits (exports of goods & services) | 13,190 | 13,218 | 13,190 | - | |
| Debits (imports of goods & services) | 15,265 | 15,332 | 15,352 | - | |
Seasonally Adjusted | |
| |
| Balance on goods & services | -1,950 | -1,997 | -2,238 | . . | |
| Credits (exports of goods & services) | 13,009 | 13,294 | 13,057 | -2 | |
| Debits (imports of goods & services) | 14,959 | 15,291 | 15,295 | - | |
| |
| . . not applicable |
| - nil or rounded to zero (including null cells) |
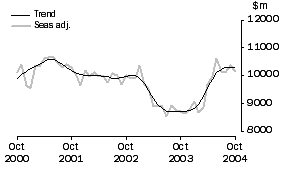
Balance on goods and services

| |
OCTOBER KEY POINTS
TREND ESTIMATES
- The provisional trend estimate of the balance on goods and services was a deficit of $2,162m in October 2004, an increase of $48m on the deficit in September.
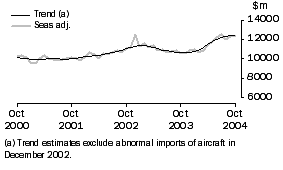
- Goods and services credits fell $28m to $13,190m. Rural goods fell $73m (3%), while non-rural and other goods rose $37m. Services credits rose $8m.
- Goods and services debits rose $20m to $15,352m. Intermediate and other goods rose $30m (1%) and capital goods rose $4m, while consumption goods fell $18m. Services debits rose $4m.
SEASONALLY ADJUSTED ESTIMATES
- In seasonally adjusted terms, the balance on goods and services was a deficit of $2,238m in October, an increase of $241m on the deficit in September.
- Goods and services credits fell $237m (2%) to $13,057m. Rural goods fell $196m (8%) and non-rural and other goods fell $8m. Services credits fell $33m (1%).
- Goods and services debits rose $4m to $15,295m. Capital goods rose $227m (8%), while intermediate and other goods fell $146m (3%) and consumption goods fell $45m (1%). Services debits fell $32m (1%).
ORIGINAL ESTIMATES
- In original terms, the October balance on goods and services was a deficit of $2,506m, a decrease of $713m on the deficit in September. Goods and services credits rose $426m (3%), while goods and services debits fell $287m (2%).
- In the four months to October, exports of non-rural and other goods were up $4.0b (14%) and rural goods were up $2.0b (28%) on the corresponding period in 2003-04.
NOTES
NEW CUSTOMS SYSTEM
From the 6th of October 2004, all goods exported from Australia were recorded and monitored using the new Customs Integrated Cargo System (ICS). The ABS published information about the changes and expected implications in a feature article released on 29th September 2004 - Implementation of New Customs Systems.
The October data has been processed and, from the statistical perspective, total exports are consistent with predictions based on previous data. However, there have been changes in reporting behaviour and at the more detailed level there are a large number of changes in the data. Some have been confirmed as measuring real world changes, including all the large changes. However, the October exports data should be used with caution as it has not been possible to confirm all of the movements and Customs reporting and monitoring processes associated with the introduction of ICS have not had time to stabilise. The Accredited Client Program has not been introduced yet.
CHANGES IN THIS ISSUE
Seasonal Factors
The seasonally adjusted and trend estimates of the current account have been revised as a result of the annual seasonal reanalysis. Revised historical and new concurrent seasonal factors are available in the electronic version of this publication (see 5368.0, Table 20, for monthly seasonal factors). Existing subscription clients to this data service should contact Kevin Yeadon on 02 6252 6255 or email <k.yeadon@abs.gov.au>
Each year a seasonal reanalysis is performed on all time series to re-estimate and assess the appropriateness of any prior corrections which have previously been applied. After the 2004 seasonal reanalysis, revisions may be observed in the seasonally adjusted and trend estimates for years impacted by the timing of Easter. This revision is due to an inappropriate Easter correction being applied historically for a small number of time series which has now been removed. The main impacts are on March and April observations in 2002, 1997, 1989, 1986 and 1978 for affected time series.
Seasonal Adjustment
The seasonally adjusted and trend estimates of the current account have changed to concurrent seasonal adjustment. An explanation and description of the implications of this change were provided in the June 2004 issue of the Balance of Payments and International Investment Position, Australia publication (ABS cat. no. 5302.0).
FEATURE ARTICLE
A feature article on Australia's Exporters, 2003-04 has been released concurrently with the release of this publication. The article is the fifth in a series analysing the characteristics and international trading activities of Australia's exporters and importers, based on the Australian Business Number (ABN).
INQUIRIES
For further information about these and related statistics, contact the National Information and Referral Service on 1300 135 070 or Artur Andrysiak on (02) 6252 6792.
ANALYSIS AND COMMENTS
BALANCE ON GOODS AND SERVICES
The trend estimate of the balance on goods and services in October 2004 was a deficit of $2,162m, an increase of $48m on the deficit in September.
In seasonally adjusted terms, the balance on goods and services in October 2004 was a deficit of $2,238m, an increase of $241m on the deficit in September.
EXPORTS OF GOODS AND SERVICES
The trend estimate of goods and services credits fell $28m in October to $13,190m.
In seasonally adjusted terms, goods and services credits fell $237m (2%) in October to $13,057m. Rural goods fell $196m (8%), services credits fell $33m (1%) and non-rural and other goods fell $8m.
Exports of goods
GOODS CREDITS
Rural goods
The trend estimate of rural goods exports fell $73m (3%) to $2,275m.
In seasonally adjusted terms, exports of rural goods fell $196m (8%) to $2,136m.
In original terms, exports of rural goods fell $34m (1%) to $2,261m.
Movements in the original series contributing to the fall in seasonally adjusted terms were:
- cereal grains and cereal preparations, down $68m (13%), in contrast to an average September to October rise of 5% over the previous three years
- wool and sheepskins, down marginally, in contrast to an average September to October rise of 20% over the previous three years
- meat and meat preparations, up $23m (4%), compared with an average September to October rise of 11% over the previous three years.
Non-rural and other goods
The trend estimate of non-rural and other goods exports rose $37m to $7,999m.
In seasonally adjusted terms, exports of non-rural and other goods fell $8m to $8,017m.
In original terms, exports of non-rural and other goods rose $193m (2%) to $8,443m.
Movements in the original series contributing to the fall in seasonally adjusted terms were:
- other goods, down $82m (12%), in contrast to an average September to October rise of 21% over the previous three years
- metal ores and minerals, up $47m (3%), compared with an average September to October rise of 8% over the previous three years
- transport equipment, up $66m (16%), compared with an average September to October rise of 28% over the previous three years
- metals (excluding gold), down $11m (2%), in contrast to an average September to October rise of 5% over the previous three years.
Mostly offsetting these effects were:
- other mineral fuels, up $40m (4%), in contrast to an average September to October fall of 17% over the previous three years
- coal, coke and briquettes, up $63m (5%), in contrast to an average September to October fall of 2% over the previous three years
- other non-rural, up $67m (7%), compared with a marginal September to October rise over the previous three years.
Exports of services
SERVICES CREDITS

In trend terms, services credits rose $8m to $2,916m.
Seasonally adjusted, services credits fell $33m (1%) to $2,904m.
Movements in the seasonally adjusted components contributing to this fall were:
- travel services, down $30m (2%)
- other services, down $8m (1%).
Partly offsetting these effects were passenger and other transportation services, up $5m (1%).
Seasonally adjusted, tourism related services credits fell $68m (4%) to $1,756m.
IMPORTS OF GOODS AND SERVICES
The trend estimate of goods and services debits rose $20m in October to $15,352m.
In seasonally adjusted terms, goods and services debits rose $4m to $15,295m. Capital goods rose $227m (8%), while intermediate and other goods fell $146m (3%), consumption goods fell $45m (1%) and services debits fell $32m (1%).
Imports of goods
GOODS DEBITS
Consumption goods
The trend estimate of imports of consumption goods fell $18m to $3,834m.
In seasonally adjusted terms, imports of consumption goods fell $45m (1%) to $3,816m.
In original terms, imports of consumption goods fell $171m (4%) to $4,205m.
Movements in the original series contributing to the fall in seasonally adjusted terms were:
- consumption goods n.e.s., down $124m (9%), in contrast to an average September to October rise of 16% over the previous three years
- non-industrial transport equipment, down $94m (8%), compared with an average September to October fall of 1% over the previous three years
- textiles, clothing and footwear, down $37m (7%), in contrast to an average September to October rise of 5% over the previous three years
- toys, books and leisure goods, up $22m (6%), compared with an average September to October rise of 21% over the previous three years.
Offsetting these effects by about 3 percentage points was an adjustment made as part of the regular seasonal adjustment process to take into account different trading day patterns in September and October.
Capital goods
The trend estimate of imports of capital goods rose marginally to $3,023m.
In seasonally adjusted terms, imports of capital goods rose $227m (8%) to $3,089m.
In original terms, imports of capital goods rose $66m (2%) to $3,086m.
Movements in the original series contributing to the rise in seasonally adjusted terms were:
- an adjustment made as part of the regular seasonal adjustment process to take into account different trading day patterns in September and October, which contributed about 8 percentage points towards the overall rise
- civil aircraft, up $232m, compared with lower September to October rises over the previous three years.
Partly offsetting these effects were:
- machinery and industrial equipment, down $69m (6%), in contrast to an average September to October rise of 16% over the previous three years
- industrial transport equipment n.e.s., down $42m (10%), in contrast to an average September to October rise of 18% over the previous three years
- automatic data processing equipment, down $63m (13%), in contrast to an average September to October rise of 6% over the previous three years.
Intermediate and Other Goods
The trend estimate of imports of intermediate and other goods rose $30m (1%) to $5,510m.
In seasonally adjusted terms, intermediate and other goods imports fell $146m (3%) to $5,422m.
In original terms, imports of intermediate and other goods fell $109m (2%) to $5,614m.
Movements in the original series contributing to the fall in seasonally adjusted terms were:
- fuels and lubricants, up $35m (3%), compared with an average September to October rise of 22% over the previous three years
- other parts for capital goods, down $66m (8%), in contrast to an average September to October rise of 14% over the previous three years
- parts for transport equipment, down $29m (5%), in contrast to an average September to October rise of 18% over the previous three years
- other goods, down $33m (7%), in contrast to an average September to October rise of 20% over the previous three years.
Offsetting these effects by about 2 percentage points was an adjustment made as part of the regular seasonal adjustment process to take into account different trading day patterns in September and October.
Imports of services
SERVICES DEBITS

In trend terms, services debits rose $4m to $2,985m.
Seasonally adjusted, services debits fell $32m (1%) to $2,968m.
Movements in the seasonally adjusted components contributing to this fall were:
- travel services, down $18m (2%)
- other services, down $10m (1%)
- freight services, down $6m (1%).
Partly offsetting these effects were passenger and other transportation services, up $2m.
Seasonally adjusted, tourism related services debits fell $22m (1%) to $1,477m.
 Print Page
 Print All