NOVEMBER KEY FIGURES
 | | September 2008 | October 2008 | November 2008 | Oct 08 to Nov 08 |
| | $m | $m | $m | % change |
|
| BALANCE ON GOODS AND SERVICES | | | | |
| Trend estimates | 1 362 | 1 718 | 2 073 | 21 |
| Seasonally adjusted | 1 111 | 2 960 | 1 448 | -51 |
| CREDITS (Exports of goods & services) | | | | |
| Trend estimates | 25 880 | 26 662 | 27 339 | 3 |
| Seasonally adjusted | 26 105 | 27 934 | 26 932 | -4 |
| DEBITS (Imports of goods & services) | | | | |
| Trend estimates | 24 518 | 24 944 | 25 266 | 1 |
| Seasonally adjusted | 24 994 | 24 974 | 25 484 | 2 |
|
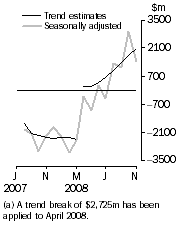
Balance on Goods and Services
| |
NOVEMBER KEY POINTS
BALANCE ON GOODS AND SERVICES
- The trend estimate of the balance on goods and services was a surplus of $2,073m in November 2008, an increase of $355m on a revised surplus in October 2008.
- In seasonally adjusted terms, the balance on goods and services was a surplus of $1,448m in November 2008, a decrease of $1,512m on a revised surplus in October 2008.
- The decrease in the seasonally adjusted surplus was primarily due to the strong fall in goods and services credits, mainly in non-rural and other goods.
CREDITS (EXPORTS OF GOODS & SERVICES)
- Seasonally adjusted, goods and services credits fell $1,002m (4%) to $26,932m. Non-rural goods fell $787m (4%), other goods fell $190m (11%) and rural goods fell $38m (1%). Services credits rose $13m.
- The fall in non-rural goods was largely driven by the metal ores and minerals component, which fell $654m (13%).
DEBITS (IMPORTS OF GOODS & SERVICES)
- Seasonally adjusted, goods and services debits rose $510m (2%) to $25,484m. Other goods rose $728m (67%) and consumption goods rose $124m (2%) while intermediate and other merchandise goods fell $393m (4%). Services debits rose $56m (1%).
- The fall in intermediate and other merchandise goods was driven by the fuels and lubricants component, which fell $791m (24%).
NOTES
FORTHCOMING ISSUES
| ISSUE | Release Date |
| December 2008 | 3 February 2009 |
| January 2009 | 5 March 2009 |
| February 2009 | 2 April 2009 |
| March 2009 | 6 May 2009 |
| April 2009 | 4 June 2009 |
| May 2009 | 2 July 2009 |
REVISIONS
Revisions were made to the previous seven months to incorporate the latest available merchandise trade data, and the previous 16 months to incorporate the latest available survey and administrative data relating to international trade in services. In original terms, these revisions have:
- increased the October 2008 surplus by $133m.
- increased the deficit on goods and services for 2007-08 by $335m, with:
- goods and services credits increasing by $110m.
- goods and services debits increasing by $445m, primarily due to services debits where revisions have been applied back to July 2007 due to the latest available data replacing estimated data.
INFORMATION PAPER
An information paper
Changes to International Trade in Goods Industry Statistics, July 2009 (cat. no. 5368.0.55.011) was released on 18 December 2008 and is accessible from the ABS web site <www.abs.gov.au>. The paper briefly advises the timing and implications of the introduction of Australian and New Zealand Standard Industrial Classification 2006 (ANZSIC06) in International Trade time series. The paper also describes arrangements for electronically accessing ANZSIC06 and related correspondences.
INQUIRIES
For further information contact Selvi Sekhar on Canberra (02) 6252 5540 for goods, and Karen McGuigan on Canberra (02) 6252 5415 for services.
 Print Page
 Print All