|
|
INTRODUCTION
Older People, NSW, 2004 is a joint publication by the Australian Bureau of Statistics (ABS) and the NSW Department of Disability, Ageing and Home Care (DADHC). It is the third in a series of publications on older people, following Older People in NSW: A Profile, 1995 and Older People, NSW, 2000. The publication draws on data from ABS and non-ABS surveys and collections, presenting a snapshot of the social and economic position of people aged 65 years and over in New South Wales (NSW).
This publication provides a rich source of information on key issues relating to community participation; health and wellbeing; living arrangements; financial security; and mobility. The picture emerging is one of older people engaged with life, actively pursuing their interests, and contributing to the social capital on which the whole community depends.
CHAPTER ONE: POPULATION
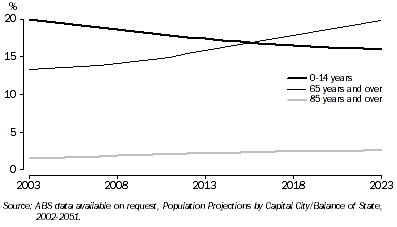
The population of NSW is ageing and this trend is expected to continue. By 2016, the older population (people aged 65 years and over) is expected to outnumber the younger population (people aged 0-14 years) for the first time in the history of NSW.
Characteristics of the older population
- In 2003, there were 889,500 older people in NSW, 13% of the state's population. Reflecting the longer life expectancy of women, there were more older women (495,100) than men (394,400), and this disparity increased with age.
- On the basis of ABS series II assumptions, the older population in NSW is projected to increase to 20% of the population by 2023.
PROJECTED POPULATION, By selected age groups

Life expectancy
- In 2002, life expectancy at age 65 years was 17.3 years for males and 20.8 years for females. Since 1982, at 65 years of age, males have gained 3.7 years of life expectancy and females 3.0 years.
Cultural diversity
- In 2001, 28% of older people in NSW were born overseas, and the largest number were born in the United Kingdom, Italy, China and Greece.
- In 2001, three per cent (3,900 persons) of the Aboriginal and Torres Strait Islander population were aged 65 years and over, compared with 13% of the total NSW population.
CHAPTER TWO: LIVING ARRANGEMENTS
As people age, they often experience changes in their living arrangements, including living as a couple, living with others (family or non-family), living alone or living in a residential aged care facility. Most older people continue to live in their own home, making use of aged care assistance packages or support from families and friends as needed.
Relationships in households
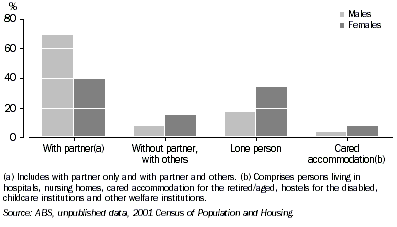
- Most older people live with someone else. In 2001, 63% lived with family members; 53% lived with their partner; 10% lived with family members other than their partner; 26% lived alone; and 6% lived in non-private dwellings, such as cared accommodation.
- Most older men (69%) lived with their partner, while only 40% of older women lived with their partner, and a higher percentage of women (34%) than men (17%) lived alone.
LIVING ARRANGEMENTS OF OLDER PEOPLE, By sex—2001

Location
- In 2002, the Statistical Divisions with the highest percentage of older persons were the Mid-North Coast (18%), Richmond-Tweed (17%) and the Far West (17%).
- In 2001, 19% of older people reported that they had moved residence in the last five years, and two-fifths of these moves were within the same Statistical Local Area (SLA).
Crime and safety
- Around 12% of older people felt unsafe or very unsafe at home alone after dark in 2002 - a similar proportion to the general population.
CHAPTER THREE: SKILLS, INTERESTS AND COMMUNITY PARTICIPATION
Improved health and life expectancy means that many older people live independent, active lives and are involved in a wide range of social, leisure and community activities.
Social interaction
- In 2002, most older people (93%) reported having contact in the previous week with family or friends with whom they did not live (either in person or via telephone, mail or e-mail).
- About 20% of all older people (or their partners) provided support to other relatives living outside the household, and grandparents provided care for 18% of all children aged 0-11 years.
Social and community activities
- In 2002, 41% of older people participated in sport or recreational physical activities, and the most common activities were walking (19%), lawn bowls (6%), golf (6%), swimming (4%) and aerobics (4%).
- In 2002, 19% of older people volunteered in welfare and community activities.
Education and Technology
- In 2001, approximately 4,000 older people attended a secondary, TAFE or tertiary educational institution - more than two-thirds attended as part-time students.
- In 2002, around one in five older persons used a computer, and 11% of older people had accessed the Internet in the last 12 months.
CHAPTER FOUR: HEALTH
Older people are living longer, healthier lives, and enjoying more years without severe handicap. Most older people rate their health as good to excellent. However, there are a significant number who experience a range of illnesses including arthritis, hypertension, heart disease, asthma, diabetes and dementia.
Self-assessed health
- In 2001, two-thirds of people aged 65 years and over assessed their health as either good, very good or excellent.
Health-related actions
- Older people took a variety of actions relating to their health in 2001, and the most common types were: visiting a general practitioner (40%), specialist (10%), dentist (6%), and consulting other health professionals (14%).
Health risks
- More than 90% of older people did not smoke or drink alcohol, or only consumed alcohol at a low risk level.
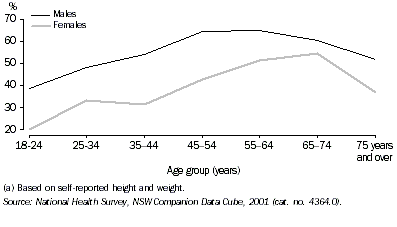
- In 2001 in NSW, 35% of older males and 39% of older females were in the normal weight range for their height. A higher percentage of older men were overweight or obese (57%) than older women (46%).
OVERWEIGHT OR OBESE(a), By age and sex—2001

Health conditions
- Cancer (all types) was the leading cause of death for older people in 2002, followed by ischaemic heart disease and stroke.
- In 2001, the long-term health conditions most frequently reported by older people were eyesight problems (81%), arthritis (48%), hypertension (41%), other circulatory diseases (33%) and hearing problems (33%).
Mental health
- In 2002, almost half (48%) of all older people or a close friend experienced at least one potentially stressful situation or event in the last 12 months, and the most common types of stressors were serious illness of self or someone close (24%); the death of someone close (16%), divorce or separation (6%) and serious disability (5%).
Health care services
- Older people received 79% of all Home and Community Care services in NSW in 2002-03. The most commonly used services were domestic assistance, transport, home care service assessment and home meal services.
- There were 537,300 separations of older people from NSW hospitals in 2002-03. The most common reasons for hospitalisation were external causes of morbidity and mortality, including falls; circulatory and digestive system conditions; and cancer (neoplasms).
CHAPTER FIVE: FINANCIAL SECURITY
Older people have lower incomes than other age groups, although they tend to have higher assets through equity in dwellings, superannuation or other savings. Most are retired and dependent on government benefits as their principal source of income. They have lower levels of household consumer debt and financial stress than other age groups.
Employment
- Less than 10% of males and 4% of females, aged 65 years and over, were still participating in the labour force at May 2004. More than half of all employed older people worked part-time.
Retirement
- Although age pensions are generally not available until the age of 65 years, in 2002, around one-quarter of all people aged 45-64 years were already retired (15% of males and 32% of females).
Income
- In 2003, approximately 69% of older people in NSW received the Australian Government age pension, and a further 8% received service pensions from the Australian Government Department of Veterans' Affairs.
Superannuation and other assets
- Superannuation is intended to provide an income throughout retirement, however, around 44% of pre-retired persons aged 55-69 years had superannuation balances of only $40,000 or less in 2000.
Housing costs and financial stress
- In 2000-01, in households where the reference person was an older person, 82% owned their houses without a mortgage, and 12% rented.
CHAPTER SIX: MOBILITY
Access to transport enables older people to maintain independence and participate in social and community life. As people age they are likely to have less access to transport, due to increased physical difficulties in using both public and private transport, and decreased access to private vehicles.
Mode and purpose of travel
- Private vehicles were the most common form of transport for both older men (70%) and women (62%), and walking as a form of transport accounted for 23% of trips in 2002.
- In 2002, the highest percentages of trips made by older people were for shopping, entertainment, and personal business or services.
Accessibility of transport
- Half of all older people living alone in Sydney did not have a motor vehicle in 2001 - a total of 52,600 households.
- In 1998, the main reasons given by older people for not using public transport, when it was available in their area, were difficulty getting into and out of vehicles or carriages (53%) and difficulty getting to stops or stations (30%).
Road traffic accidents
- People in age groups over 50 years were more likely to be killed as pedestrians than younger age groups, in 2002.
|
 Print Page
 Print All