NOTES
OVERVIEW
This is the final issue of this electronic product. It is intended that future state and territory-specific data will be made available in spreadsheet format with releases of the relevant annual national publications.
This electronic product provides a demographic overview of Queensland, 2004. It contains summary tables and commentary on trends in the components of population change including births, deaths and migration. Marriages, divorces, estimated resident population and various demographic rates are also presented. Population and migration data are for the year ended 30 June 2004, while births, deaths, marriages and divorces data are for the year ended 31 December 2004. More recent data are released quarterly in Australian Demographic Statistics (cat. no. 3101.0)..
For comparisons between the states and territories of Australia, please refer to Demography, Australia, 2004 (cat. no. 3311.0.55.001). Demography publications for each state and territory can be accessed from the Related Information tab at the top of this page. Additional state demographic data are also available from publications and data cubes linked at the top of this page. The Demography Theme Page provides links to other Australian as well as international demographic statistics. The National Regional Profiles provide economic and social statistics of Statistical Local Areas and Local Government Areas of Australia.
INQUIRIES
For further information about these and related statistics, contact the National Information and Referral Service on 1300 135 070 or Shell McConville on Brisbane (07) 3222 6428.
SUMMARY COMMENTARY
INTRODUCTION
As at 30 June 2004, Queensland had a population of 3,888,000 persons accounting for 19.4% of the Australian population. Queensland had the highest rate of population growth of all states and territories during 2003-04. The main contributor to this high rate of growth was net interstate migration.
In 2004, the number of births was the highest ever recorded in the state (49,900). Queensland's crude marriage rate also continued to be the highest for any state or territory, and the crude birth and the infant mortality rates were higher than the national average in 2004.
POPULATION
The estimated resident population of Queensland at 30 June 2004 was 3,888,000 persons, consisting of 1,943,000 males and 1,945,000 females.
Between 30 June 2003 and 30 June 2004, Queensland's population grew at a rate of 2.3%. This remains the highest rate of growth for all states and territories and is above the Australian average of 1.1%.
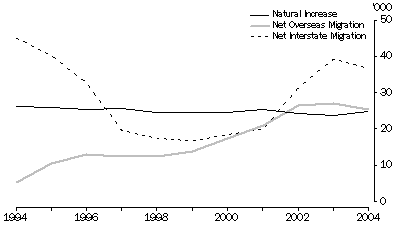
The population increase during 2003-04 was 87,000 persons, comprising net interstate migration of 36,700 persons, net overseas migration of 25,400 persons and a natural increase of 25,000 persons.
Persons aged under 15 years accounted for 20.6% of the Queensland population at 30 June 2004 compared with 22.3% in 1994. Over this ten-year period, the proportion of persons aged 65 years and over has increased from 11.0% to 12.0% and for those aged 85 years and over from 0.9% to 1.3%.
COMPONENTS OF POPULATION CHANGE, Queensland

POPULATION AND HOUSEHOLDS, Queensland - Selected years at 30 June |
|  |
 |  |  | 1994 | 2003 | 2004 |  |
|  |
| Estimated resident population | ('000) | 3 187.1 | 3 801.0 | 3 888.1 |  |
| Components of population change(a) |  |  |  |  |  |
 | Natural increase(b) | no. | 26 180 | 23 738 | 24 953 |  |
 | Net overseas migration | no. | 5 241 | 27 122 | 25 399 |  |
 | Net interstate migration | no. | 44 936 | 39 207 | 36 686 |  |
| Total increase(a)(c) | no. | 77 325 | 90 067 | 87 038 |  |
| Annual growth rate(a) | % | 2.49 | 2.43 | 2.29 |  |
| Estimated resident households(d) | ('000) | 1 169.2 | nya | nya |  |
| Projected households(e) | ('000) | . . | 1 464.5 | 1 504.8 |  |
|  |
| . . not applicable |
| nya not yet available |
| (a) From 30 June previous year. |
| (b) Excess of births over deaths. Births and deaths figures used to compile natural increase for population estimates are based on year of occurrence and may differ from births and deaths data based on year of registration displayed in the Births and Deaths sections of this paper. |
| (c) Includes intercensal discrepancy not accounted for by natural increase and net migration. |
| (d) Based on 1996 census data. |
| (e) Series II from Household and Family Projections, Australia, 2001-2026 (Cat. no. 3236.0). |
BIRTHS AND CONFINEMENTS
In 2004, there were 49,100 confinements resulting in 49,900 live births registered to mothers usually resident in Queensland, the highest number ever recorded. There were 25,600 male births and 24,400 female births, giving a sex ratio of 105.1 males per 100 females. Queensland's crude birth rate of 12.8 births per 1,000 population was slightly higher than the rate for Australia as a whole (12.7 births per 100,000 population).
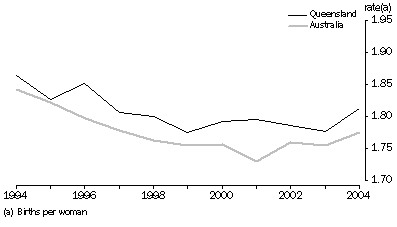
The total fertility rate (the average number of babies a female would bear during her lifetime if she experienced current age-specific fertility rates) was 1.81 babies per woman in 2004.
TOTAL FERTILITY RATES

The median age of Queensland mothers for all confinements increased to 29.8 years in 2004 from 29.7 years in 2003. The median age of Queensland mothers was lower than for all Australia (30.6 years).
Exnuptial births represented 37.8% of all live births registered in Queensland in 2004, which is substantially greater than the 29.7% in 1994.
In 2004, there were 843 sets of twins and higher order births registered, which means one in every 58 confinements resulted in a multiple birth in Queensland. This is an increase in multiple births from 1994 when one in every 74 confinements resulted in a multiple birth.
BIRTHS AND CONFINEMENTS, Queensland - Selected years(a) |
|  |
 |  |  | 1994 | 2003 | 2004 |  |
|  |
| Live births |  |  |  |  |  |
 | Number | no. | 46 578 | 48 342 | 49 940 |  |
 | Crude birth rate(b) | rate | 14.6 | 12.7 | 12.8 |  |
 | Total fertility rate(c) | rate | 1.863 | 1.776 | 1.811 |  |
 | Net reproduction rate(d) | rate | 0.885 | 0.854 | 0.873 |  |
| All confinements |  |  |  |  |  |
 | Number | no. | 45 941 | 47 601 | 49 102 |  |
 | Median age of mother | years | 28.4 | 29.7 | 29.8 |  |
| Nuptial confinements |  |  |  |  |  |
 | Number | no. | 32 244 | 29 837 | 30 448 |  |
 | Median age of mother | years | 29.6 | 31.1 | 31.2 |  |
 | Median age of father | years | 31.9 | 33.0 | 33.1 |  |
| First nuptial confinements |  |  |  |  |  |
 | Number | no. | 12 976 | 12 265 | 12 630 |  |
 | Median age of mother | years | 28.2 | 29.9 | 30.0 |  |
|  |
| (a) Year of registration. |
| (b) Births per 1,000 population. |
| (c) Births per woman. |
| (d) Daughters surviving to reproductive age per woman. |
DEATHS
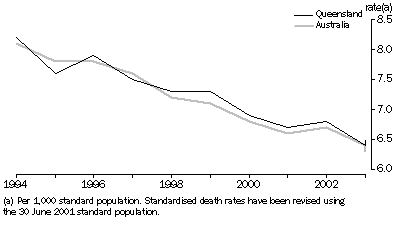
In 2004, there were 24,500 registered deaths of persons usually resident in Queensland, comprising 13,000 males and 11,500 females. This was an increase of 4.3% on the number registered in 2003 and an increase of 13.2% from 1994, when there were 21,700 deaths. The standardised death rates have fallen from 8.2 deaths per 1,000 population in 1994 to 6.5 deaths per 1,000 population in 2004.
STANDARDISED DEATH RATES

In 2004, the median age at death in Queensland and was 75.9 years for males and 82.2 years for females. This is slightly lower than the Australian median age at death of 76.6 years and 82.6 years respectively.
There were 260 infant deaths registered in 2004, a 13.9% increase on the 230 infant deaths registered in 2003. In comparison, the number of infant deaths decreased by 1.3% for Australia as a whole between 2003 and 2004. The infant mortality rate in Queensland for 2004 was 5.2 per 1,000 live births, which is substantially lower than the 1994 rate of 6.2 per 1,000 live births.
Life expectancy at birth continued to increase. A male child born in 2004 in Queensland has a life expectancy of 77.8 years, while a female child has a life expectancy of 82.9 years.
DEATHS, Queensland - Selected years(a) |
|  |
 |  |  | 1994 | 2003 | 2004 |  |
|  |
| Number | no. | 21 655 | 23 500 | 24 514 |  |
| Crude death rate(b) | rate | 6.8 | 6.2 | 6.3 |  |
| Standardised death rate(c) | rate | 8.2 | 6.4 | 6.5 |  |
| Median age at death |  |  |  |  |  |
 | Males | years | 73.2 | 75.6 | 75.9 |  |
 | Females | years | 79.7 | 81.9 | 82.2 |  |
| Infant deaths |  |  |  |  |  |
 | Number | no. | 289 | 230 | 262 |  |
 | Infant mortality rate(d) | rate | 6.2 | 4.8 | 5.2 |  |
| Life expectancy at birth(e) |  |  |  |  |  |
 | Males | years | 74.7 | 77.6 | 77.8 |  |
 | Females | years | 80.8 | 82.8 | 82.9 |  |
|  |
| (a) Year of registration. |
| (b) Deaths per 1,000 population. |
| (c) Deaths per 1,000 population. Standardised death rates use total persons in the 2001 Australian population as the standard population. |
| (d) Deaths per 1,000 live births. |
| (e) From 1995 onwards expectation of life has been calculated using three years of data. |
MIGRATION
In 2003-04, Queensland's population grew by 36,700 from interstate migration. The net gain was the result of 116,000 arrivals and 78,900 departures. This was a decrease of 6.4% over the preceding year (39,200 persons), and is 18.4% less than the number in 1993-94 (44,900).
Net overseas migration during 2003-04 was 25,400, a decrease of 6.4% over 2002-03 (27,100).
The net population gain from migration, combining both overseas and interstate migration, was 62,100 persons in 2003-04.
MARRIAGES
There were 24,300 marriages registered in Queensland in 2004. This represents an increase of 16.9% on the number of marriages in 1994 (20,800) and 9.2% in 2003 (22,300).
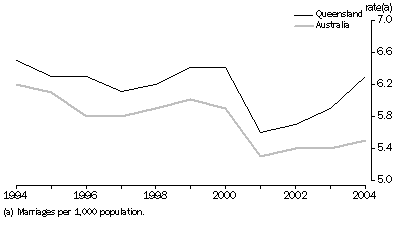
In 2004, the crude marriage rate for Queensland was 6.3 marriages per 1,000 population. Queensland continued to record the highest crude marriage rate of all states and territories, and was higher than the national average rate of 5.5 per 1,000 population. The crude marriage rate for Queensland has decreased 3.1% between 1994 and 2004.
CRUDE MARRIAGE RATES

The median age at marriage in Queensland was 31.6 years for males and 29.4 years for females in 2004. The difference of two years between the median age of partners has remained stable over the past decade.
The increasing preference for civil marriage ceremonies over religious marriage ceremonies continued in 2004. Civil celebrants performed 61.9% of all marriages in Queensland, while ministers of religion performed the remaining 38.1%. This compares with civil celebrants performing 45.4% of marriages in 1994.
MARRIAGES, Queensland - Selected years(a) |
|  |
 |  |  | 1994 | 2003 | 2004 |  |
|  |
| Number registered(a) | no. | 20 798 | 22 273 | 24 312 |  |
| Crude marriage rate(b) | rate | 6.5 | 5.9 | 6.3 |  |
| Median age at marriage |  |  |  |  |  |
 | Bridegroom | years | 28.9 | 31.4 | 31.6 |  |
 | Bride | years | 26.5 | 29.3 | 29.4 |  |
|  |
| (a) For 2004, marriage registrations were sampled for Queensland and therefore subject to sampling error. |
| (b) Marriages per 1,000 population. |
DIVORCES
In 2004, 13,300 divorces were granted in Queensland. This represents a 24.3% increase over the number of divorces granted in 2003, and a 36.0% increase since 1994. The increase from 2003, was due to a large number of divorces of usual residents in NSW being registered in Queensland due to changes in the processing of applications.
The crude divorce rate in Queensland in 2004 was 3.4 divorces per 1,000 population, increasing from 2.8 per 1,000 population in 2003. This rate was above the national rate of 2.6 divorces per 1,000 population.
In Queensland, the median interval between marriage and divorce was 12.8 years in 2004. This is consistent with a continuation of the gradual increase over the past decade in the median interval between marriage and divorce, with an interval of 11.3 years recorded in 1994.
DIVORCES, Queensland - Selected years |
|  |
 |  |  | 1994 | 2003 | 2004 |  |
|  |
| Number granted | no. | 9 762 | 10 681 | 13 279 |  |
| Crude divorce rate(a) | rate | 3.1 | 2.8 | 3.4 |  |
| Median duration of marriage |  |  |  |  |  |
 | To divorce | years | 11.3 | 12.4 | 12.8 |  |
 | To separation | years | 8.0 | 8.8 | 9.1 |  |
|  |
| (a) Divorces per 1,000 population. |
RELATED LINKS
Demographic data for all Queensland statistical local areas are available from the data cube linked on the Details tab at the top of this page.
From the Related Information Tab there are links to other releases providing more specific or in-depth analysis and information
 Print Page
 Print All