ATTENDANCE
Nature parks and reserves
Nature parks and reserves includes Australia's national parks and other protected areas of land or sea especially dedicated to the protection of biodiversity and other natural and cultural resources.
Australia has over 1,500 World Heritage Areas, and national and state parks and reserves which are managed by the Australian Government and each of the state governments. The area covered extends beyond Australia's coastline to include marine protected areas up to three nautical miles out to sea as well as national parks on the Cocos (Keeling), Christmas and Norfolk Islands.
More than 7.6 million or 54% of Australians aged 18 years and over visited a World Heritage area, national or state park in the twelve months prior to March 2001, according to a survey conducted by the ABS.
A similar survey conducted in 1998 also reported a 54% attendance rate, while a survey in 1992 reported 63% of Australians visiting these areas. Residents of the Australian Capital Territory recorded the highest attendance rate (64%) and South Australians the lowest (50%).
9.1 ATTENDANCE AT NATURE PARKS(a), By state and territory - 2001(b) |
|  |
 | Number | Attendance rate |  |
 | '000 | % |  |
|  |
| New South Wales | 2 548.1 | 52.8 |  |
| Victoria | 1 806.8 | 50.3 |  |
| Queensland | 1 488.4 | 56.5 |  |
| South Australia | 557.4 | 49.6 |  |
| Western Australia | 828.3 | 59.6 |  |
| Tasmania | 196.0 | 57.1 |  |
| Northern Territory | 63.7 | 58.7 |  |
| Australian Capital Territory | 145.5 | 63.8 |  |
| Australia | 7 634.2 | 53.6 |  |
|  |
| (a) Includes world heritage parks and state parks. |
| (b) Twelve months before interview in 2001. |
| ABS, Environmental Issues: People's Views and Practices, March 2001 (cat. no. 4602.0). |
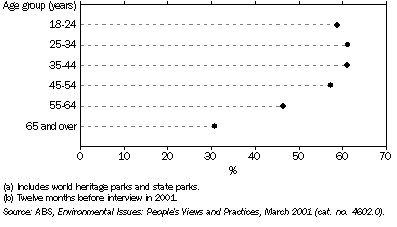
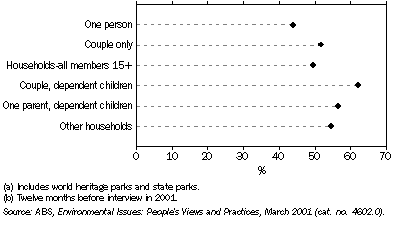
The survey found that Australians aged 25-44 years, and households with children were the most likely to visit a nature park.
9.2 Attendance at Nature Parks(a), By age - 2001(b)

9.3 Attendance at Nature Parks(a), By household type - 2001(b)

 Print Page
 Print All
 Print Page
 Print All