JULY KEY FIGURES
 | | Jul 09 | Jun 09 to Jul 09 |
| | $m | % change |
|
| Turnover at current prices | | |
| Trend estimates | na | na |
| Seasonally adjusted estimates | 19 616.0 | -1.0 |
|
| na not available |
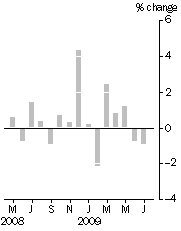
Monthly Turnover, Current prices - Seasonally adjusted
| |
JULY KEY POINTS
SUSPENSION OF TREND ESTIMATES
- The retail trade current price trend series have been suspended as at November 2008 as it is not possible to determine the trend in retail turnover through the period affected by the Government's stimulus package and other influences associated with global economic conditions. For further details refer to the December 2008 issue of this publication.
NEW INDUSTRY CLASSIFICATION
CURRENT PRICE
- The seasonally adjusted estimate of Australian turnover decreased 1.0% in July 2009. This follows a decrease of 0.8% in June 2009 and an increase of 1.2% in May 2009.
- In original terms, Australian turnover increased 2.3% in July 2009 compared with June 2009. Chains and other large retailers (which are completely enumerated) increased 3.2% and the estimate for 'smaller' retailers increased 0.8%. Australian turnover increased 5.1% in July 2009 compared with July 2008.
- In seasonally adjusted terms, Food retailing (-1.9%), Household goods retailing (-3.6%) and Clothing, footwear and personal accessory retailing (-0.6%) decreased in July 2009 while Department stores (+2.5%), Other retailing (+0.8%) and Cafes, restaurants and takeaway food services (+1.0%) increased.
- In seasonally adjusted terms, all states, except the Northern Territory, decreased in July 2009. States with the largest decreases were Queensland and South Australia (both -1.4%) and New South Wales (-1.2%).
NOTES
FORTHCOMING ISSUES
| ISSUE | Release Date |
| August 2009 | 30 September 2009 |
| September 2009 | 4 November 2009 |
| October 2009 | 3 December 2009 |
| November 2009 | 7 January 2010 |
| December 2009 | 4 February 2010 |
| January 2010 | 2 March 2010 |
REVISIONS
With the introduction of
Australian and New Zealand Standard Industrial Classification (ANZSIC), 2006 (cat. no. 1292.0), all estimates in original terms, except Department stores, have been revised for all time series. For more information on this change see page 3 of this issue.
TIME SERIES DATA
Data available from the Downloads tab of this issue on the ABS website include longer time series of tables in this publication and the following additional current price monthly series:
- Retail turnover by state and 15 industry subgroups in trend, seasonally adjusted and original terms.
Completely enumerated and sample sector time series normally released with this publication are not available with this issue. Further analysis is being undertaken to validate the historical series which has been recalculated on an ANZSIC 2006 basis. This does not impact on the series released with this issue. The following series will be released with the August 2009 issue:
- Retail turnover completely enumerated and sample sector, by six industry groups in original terms
- Retail turnover completely enumerated and sample sector, by state in original terms
- Retail turnover completely enumerated sector, total level in trend, seasonally adjusted and original terms.
SAMPLING ERRORS
Standard errors for the Australian estimates (original data) for July 2009 contained in this publication are:
| Data Series | Estimate | Standard error |
|
| Level of retail turnover ($m) | 19 335.7 | 140.3 |
| Change from preceding month ($m) | 432.8 | 86.5 |
| % change from preceding month (%) | 2.3 | 0.5 |
|
For more information see the Explanatory Notes, paragraphs 34-37.
INQUIRIES
For further information about these and related statistics, contact the National Information and Referral Service on 1300 135 070 or Neil Hamilton on Canberra (02) 6252 5990.
 Print Page
 Print All