EXPENDITURE
Recurrent expenditure recorded for Free-standing day hospital facilities in 2009-10 was $592 million. This was an increase of 17.2% since 2008-09, when $505 million was recorded. When adjusted for price changes, recurrent expenditure increased by 13.0% from the previous cycle ($655 million) and the average annual increase in recurrent expenditure was 10.1% over the five year period from 2004-05 ($353 million) to 2009-10 ($571 million). This did not include 2007-08 because the Private Health Establishments Collection was not undertaken for the cycle. See Explanatory Note 23 for more information concerning the use of chain volume measures to adjust income and expenditure.
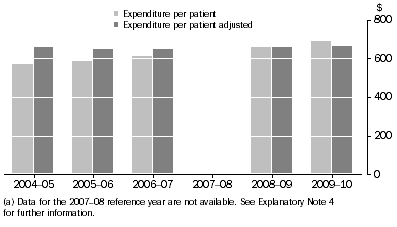
The average expenditure per patient separation increased from $660 in 2008-09 to $688 in 2009-10. In price adjusted terms, the average expenditure per patient separation in 2009-10 increased by 0.2% over the previous five cycles, from $657 in 2004-05 to $664 in 2009-10. The average annual movement in expenditure per patient separation has remained steady from 2004-05 to 2009-10. This did not include 2007-08 because the Private Health Establishments Collection was not undertaken for the cycle. See Explanatory Note 23 for more information concerning the use of chain volume measures to adjust income and expenditure.
Gross capital expenditure for Free-standing day hospital facilities during 2009-10 was $43 million, a decrease of 10.7%. Capital expenditure represented 7.3% of total expenditure in 2009-10, down from 9.6% in 2008-09.
Free standing Day Hospitals, Expenditure per patient
: 2004-05 to 2009-10(a)

 Print Page
 Print All
 Print Page
 Print All