APPENDIX 4 THE WEALTH AND EXPENDITURE OF LOW INCOME HOUSEHOLDS
INTRODUCTION
For most people, household income is the most important determinant of economic wellbeing. However, income is not the only economic resource available to households. Households that have higher levels of net worth, or wealth, can utilise their assets to support a higher standard of living.
For some time, the ABS has noted that households at the very lowest end of the income distribution have average expenditures higher than those households with somewhat higher average levels of income. Due to this observation, the ABS has adopted the practice of describing the characteristics of persons in the second and third deciles of the income distribution when describing the characteristics of low income people.
The 2003-04 SIH and HES were the first ABS surveys to collect comprehensive income, wealth and expenditure data from households. This appendix uses data from the HES to analyse the relationships between the income, wealth and expenditure of households in order to get a better understanding of the characteristics of households at the lowest end of the income distribution.
DATA USED
The estimates of income, net worth and expenditure used in this appendix have been adjusted for differences in household size and composition, that is, they are on an equivalised basis. The equivalisation of income is described in the Explanatory Notes. The same process is used in this appendix to equivalise net worth and expenditure in order to maximise the comparability of the three aggregates for the type of analysis being carried out.
Since expenditure data are only available from the HES, the mean values included in this appendix are all derived from the HES data. They are averages derived across all households. However, the income and net worth levels defining the boundaries of the income deciles and net worth quintiles have been derived using the larger data set available from the SIH. Furthermore, the deciles and quintiles are defined to contain equal numbers of persons rather than households. The income deciles are therefore consistent with the equivalised disposable household income quintiles and deciles presented in the main body of this publication and in Household Income and Income Distribution, Australia, 2003-04 (cat. no. 6523.0).
EXPENDITURE AND INCOME
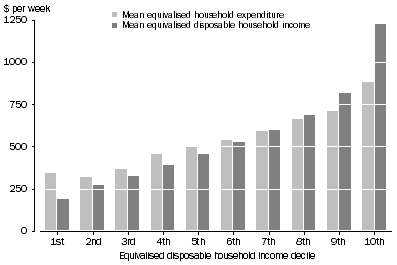
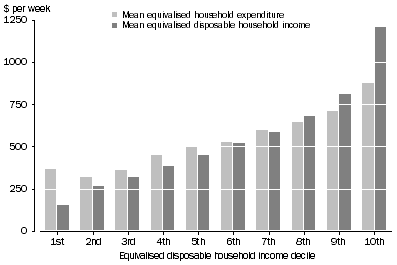
Graph A4.1 compares mean expenditure with mean income, with households ranked into deciles according to their income (with each decile containing equal numbers of persons, as explained above). As would be expected, it shows that expenditure levels are correlated to income levels. However, the mean expenditure of households in the lowest income decile is 8% higher than the mean expenditure of households in the second income decile, while the mean income of the lowest income decile is only 69% that of the households in the second decile.
A4.1 EXPENDITURE AND INCOME, All households
EXPENDITURE AND WEALTH
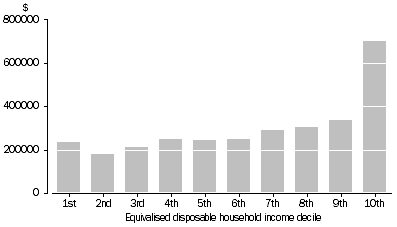
The size of the gap between expenditure and income for households in the lowest income decile, and the fact that their expenditure is higher than that of households in the second income decile, suggests that at least some households in the first decile have access to relatively more economic resources than indicated by their recorded income. Graph A4.2 shows that the average level of household net worth, or wealth, is somewhat correlated to the average level of income, but the correlation is not strong. Of particular interest, the households in the lowest income decile have higher net worth than the households in the second and third income deciles.
A4.2 MEAN EQUIVALISED HOUSEHOLD NET WORTH, All households
The influence of net worth on expenditure is shown in graph A4.3. Average expenditure is shown for households classified by net worth quintile and income decile. Within each income decile, households with higher net worth had higher expenditure. That relationship is strongest for households in the lowest income decile, where mean expenditure of households in the highest net worth quintile is 60% higher than that of households in the lowest net worth quintile. The relatively high mean expenditure of households in the lowest income decile can be partly explained by the relatively higher mean net worth of those households.
A4.3 MEAN EQUIVALISED HOUSEHOLD EXPENDITURE, Households in first six income deciles
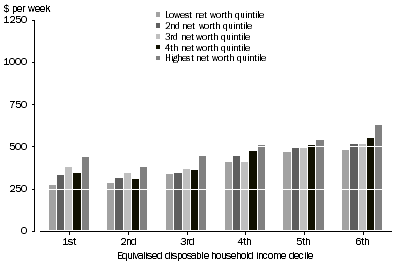
Graph A4.3 shows the expenditure of households classified by both income decile and net worth quintile. It can be seen that the mean expenditure of households falling in the lowest net worth quintile and the lowest income decile is lower than the mean expenditure of households in the lowest net worth quintile and the second income decile, as might be expected.
But contrary to expectations, that relationship does not hold for the other net worth quintiles. For example, the mean expenditure of households in the second net worth quintile and the lowest income decile is 7% higher than that of households in the same net worth quintile and the second income decile, even though mean net worth for those households in the lowest income decile is slightly lower (2%) than that for households in the second income decile, and mean income is 33% lower. A similar situation applies for households in the third and fourth net worth quintiles. For the highest net worth quintile, the situation is not so clear because the mean net worth of households in the lowest income decile and highest net worth quintile is somewhat higher than that of corresponding households in the second income decile (16%). Overall, this suggests that there are factors in addition to the relative levels of income and wealth that impact on the relative expenditure levels of households in the first and second income deciles.
OWN UNINCORPORATED BUSINESS AND RENTAL PROPERTY
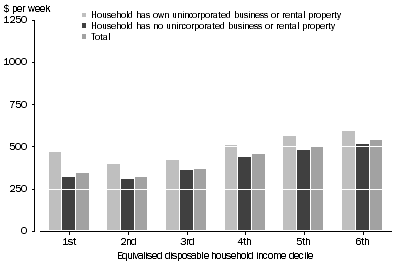
Households may have access to economic resources other than income and wealth as reported in the household surveys. Some households that have own unincorporated business or rental property may have greater temporary cash flow than indicated by their recorded income level. This is because the value of their income is calculated net of depreciation expenses which do not necessarily have to be paid out of cash receipts in the short term. They may also be able to access credit more easily than other households through lines of credit established for business purposes. Households with an unincorporated business or rental property comprised 16% of households in the lowest income decile and 11% in the second income decile. Graph A4.4 shows that these households did have substantially higher average expenditure than other households in the same income decile. But the graph also shows that the other households in the lowest income decile still had higher average expenditure than the corresponding households in the second income decile.
A4.4 MEAN EQUIVALISED HOUSEHOLD EXPENDITURE, Households in first six income deciles
HOUSEHOLDS WITHOUT OWN UNINCORPORATED BUSINESS OR RENTAL PROPERTY
Table A4.5 provides details about the characteristics of households in the lowest two income deciles, for those households without own unincorporated business or rental property, cross-classified according to their level of net worth. Mean expenditure by households in the lowest income decile and lowest net worth quintile ($263 per week) was 7% lower than that for the corresponding households in the second income decile ($282). However, for the second net worth quintile, mean expenditure by households in the lowest income decile was 5% higher than that of households in the second income decile ($311 compared to $295), even though average net worth within this net worth quintile was slightly lower for the first income decile than for the second income decile. For the third to fifth net worth quintiles, mean expenditure was 11% higher in the lowest income decile compared to the second income decile ($366 compared to $331), but in this case average net worth of households in the third to fifth net worth quintiles was also higher ($395,000 compared to $300,000, or 32% higher).
The lowest net worth quintile contained 335,000, or 40%, of the households in the lowest income decile, and 295,000, or 37%, of those in the second decile. In both income deciles, 90% of the households in the lowest net worth quintile relied on government pensions and allowances as their principal source of income, and about 90% also rented their dwellings. Lone persons comprised 56% of the households in the lowest net worth quintile within the lowest income decile, with 15 to 64 year olds more numerous than those aged 65 years and above. Lone persons accounted for a smaller proportion of the households in the lowest wealth quintile of the second income decile (32%) but were still the largest category, with equal numbers of 15 to 64 year olds and those aged 65 years and above. The next largest category was one parent families with dependent children (29%).
Government pensions and allowances also was the principal source of income for most households with higher levels of wealth and falling into the lowest and second income deciles. Other income, such as investment income, was the principal source for 16% of households in the third to fifth net worth quintiles of the lowest income decile.
There was a marked difference in home ownership between the lowest net worth quintile and the higher quintiles, with over 95% of households owning their own home in the third to fifth net worth quintiles in both the lowest and second income deciles. Of these, relatively few had a mortgage. Lone persons were the largest category of households in the higher net worth quintiles of the lowest income decile, with lone persons aged 65 years and over accounting for 42% of those in the third to fifth quintiles. Older couples were the largest category in the second income decile.
Of the data presented here, the only clear potential contributor to households in the lowest income decile having higher expenditure than those in the second income decile is the higher mean net worth of the households in the lowest income decile.
There are likely to be a number of differences between the households in the lowest and second income deciles that are not explicit in the available data but may contribute to different expenditure patterns. Of particular interest are those households that appear to have income below levels generally available through the safety net of the Australian social security system of Centrelink or similar income support payments, even though they do not have too many assets to qualify for these payments. Some households will only have the low income for a relatively short period of time and therefore their members may not be eligible for income support payments, or choose not to apply for them. Such households are likely to be more willing to utilise their savings to maintain relatively high levels of expenditure.
Some people of working age may for a variety of reasons not meet the mutual obligation requirements required to qualify for income support. They may have a preference to stay out of the labour force for a period of time, either while between jobs or until reaching retirement age. Given the longer periods of time involved, these people may be less able to consistently utilise savings to maintain relatively high levels of expenditure.
In addition, some survey respondents are likely to unintentionally or intentionally report less than their full income in the survey, but it is not clear that under-reporting of income would be greater than the under-reporting of wealth or expenditure. Even if there is a greater tendency by respondents to under-report income, it is not clear that inconsistencies in reporting income, expenditure and wealth would be greater for households in the bottom income decile than in the higher income deciles. Therefore it is not considered that the under-reporting of income is likely to have made a major contribution to households in the lowest income decile having higher average expenditure than those in the second income decile.
A4.5 CHARACTERISTICS OF HOUSEHOLDS IN LOWEST AND SECOND INCOME DECILES - HOUSEHOLDS WITHOUT OWN UNINCORPORATED BUSINESS OR RENTAL PROPERTY |
|  |
 |  |  |  |  |  | Lowest income decile | Second income decile |  |
 |  |  |  |  |  | Net worth quintile 1 | Net worth quintile 2 | Net worth quintile 3-5 | Total | Net worth quintile 1 | Net worth quintile 2 | Net worth quintile 3-5 | Total |  |
|  |
| Mean equivalised disposable income per week | $ | 202 | 191 | 192 | 196 | 271 | 273 | 271 | 271 |  |
| Mean equivalised net worth | $ | 15 000 | 85 000 | 395 000 | 209 000 | 14 000 | 88 000 | 300 000 | 162 000 |  |
| Mean equivalised expenditure per week | $ | 263 | 311 | 366 | 319 | 282 | 295 | 331 | 308 |  |
| Proportion of households with characteristic |  |  |  |  |  |  |  |  |  |  |
 | Principal source of household income |  |  |  |  |  |  |  |  |  |  |
 |  | Wages and salaries | % | *4 | *11 | 6 | 6 | 10 | *14 | 9 | 10 |  |
 |  | Government pensions and allowances | % | 90 | 84 | 78 | 83 | 90 | 85 | 88 | 88 |  |
 |  | Other income | % | *7 | *6 | 16 | 11 | - | **1 | *3 | *2 |  |
 |  | Total | % | 100 | 100 | 100 | 100 | 100 | 100 | 100 | 100 |  |
 | Tenure type |  |  |  |  |  |  |  |  |  |  |
 |  | Owner without a mortgage | % | *2 | 36 | 85 | 46 | **1 | 40 | 89 | 49 |  |
 |  | Owner with a mortgage | % | *2 | 23 | 11 | 9 | *3 | 33 | 9 | 10 |  |
 |  | Renter | % | 89 | 29 | *2 | 40 | 93 | 18 | *2 | 38 |  |
 |  | Other tenure type | % | 7 | *11 | *2 | 5 | *3 | *10 | **1 | *3 |  |
 |  | Total | % | 100 | 100 | 100 | 100 | 100 | 100 | 100 | 100 |  |
 | Family composition of household |  |  |  |  |  |  |  |  |  |  |
 |  | One family households |  |  |  |  |  |  |  |  |  |  |
 |  |  | One parent family with dependent children | % | 16 | *6 | *1 | 8 | 29 | 20 | **2 | 15 |  |
 |  |  | Couple only family, reference person aged |  |  |  |  |  |  |  |  |  |  |
 |  |  |  | 15-64 | % | *4 | *7 | 11 | 8 | *8 | *10 | 16 | 12 |  |
 |  |  |  | 65 and over | % | *3 | *6 | 9 | 6 | 8 | 28 | 39 | 26 |  |
 |  |  | Other one family households | % | 15 | *21 | 8 | 12 | 15 | 25 | 11 | 14 |  |
 |  | Lone person aged |  |  |  |  |  |  |  |  |  |  |
 |  |  | 15-64 | % | 36 | 34 | 26 | 31 | 16 | *5 | *6 | 9 |  |
 |  |  | 65 and over | % | 20 | 21 | 42 | 31 | 16 | *9 | 23 | 18 |  |
 |  | Other households | % | *6 | **5 | *2 | 4 | *8 | **2 | *3 | 5 |  |
 |  | Total | % | 100 | 100 | 100 | 100 | 100 | 100 | 100 | 100 |  |
| Estimated number in population |  |  |  |  |  |  |  |  |  |  |
 | Households | '000 | 334.6 | 94.0 | 410.6 | 839.2 | 295.2 | 117.1 | 379.1 | 791.4 |  |
 |  | % | 40 | 11 | 49 | 100 | 37 | 15 | 48 | 100 |  |
 | Persons | '000 | 659.6 | 192.6 | 615.0 | 1 467.3 | 731.1 | 305.4 | 731.9 | 1 768.4 |  |
 |  | % | 45 | 13 | 42 | 100 | 41 | 17 | 41 | 100 |  |
|  |
| * estimate has a relative standard error of 25% to 50% and should be used with caution |
| ** estimate has a relative standard error greater than 50% and is considered too unreliable for general use |
| - nil or rounded to zero (including null cells) |
EARLIER SURVEYS
The 2003-04 HES and SIH introduced an improved methodology for collecting and estimating the current income from business and investments, resulting in a smaller number of households with very low income estimates. In previous SIH cycles, current business and investment income was estimated using prior year income as the proxy for current income. This method resulted in, for example, startup business losses being extrapolated forward. The 2003-04 survey collected sufficient information to enable estimates for 2003-04 to be made on a basis largely consistent with the methodology used prior to 2003-04.
Graph A4.6 presents estimates of mean expenditure and mean income based on income estimates derived using the earlier methodology, and is likely to better describe the situation underlying estimates published for previous SIHs. On this basis, the mean expenditure of households in the lowest income decile is about equal to the expenditure of households in the third income decile. It is also 15% higher than the mean expenditure of households in the second income decile, while the mean income of the lowest income decile is only 58% that of the households in the second decile. In other words, the gap between expenditure and income for the lowest income decile was greater under the earlier methodology than under the current methodology. It can therefore be concluded that, for HESs and SIHs conducted prior to 2003-04, the income of many households in the lowest income decile was even less representative of their access to economic resources than is the case for the published estimates for 2003-04.
A4.6 EXPENDITURE AND INCOME, PREVIOUS METHODOLOGY, All households
CONCLUSION
Average expenditure by households in the lowest income decile is higher than the average expenditure by households in the second income decile, suggesting that these households have a disproportionately greater access to economic resources other than income as measured in the HES and SIH. Improvements in collection and estimation methodology in the 2003-04 surveys increased the estimates of average levels of business and investment income, but the gap between the mean expenditure and mean income of households in the lowest income decile was still markedly greater than the gap for the second income decile.
For a given level of average income, households with higher levels of average wealth have higher levels of average expenditure. Households within the lowest income decile have higher average wealth than households in the second income decile, and this at least partly explains the higher expenditure of the lowest income decile. The higher expenditure is also partly explained by the greater proportion of households in the lowest income decile having own unincorporated business or rental property. The gap between expenditure and income was markedly greater for these households, suggesting that they have access to other economic resources.
It is not clear that these reasons fully explain the higher average expenditure of households in the lowest income decile, but it is not considered that misreporting of income is a major contributing factor.
The data presented in this appendix shows that average expenditure is higher for households in the lowest income decile than those in the second income decile. It is therefore concluded that the average standard of living of these households is likely to be higher than those of households in the second income decile. However, it needs to be emphasised that nearly half the people living in households in the lowest income decile and without own unincorporated business or rental property are also in the lowest net worth quintile and have mean expenditure lower than the corresponding households in the second income decile. These people are likely to have lower average standards of living than people in households in the second income decile. It also needs to be emphasised that some households with low income that have their own unincorporated business or rental property will not have access to other economic resources and will also have low standards of living.
Nearly all (90%) households falling into both the lowest net worth quintiles and the lowest income quintile relied on government pensions and allowances as their principal source of income and about 90% also rented their dwellings. Lone person households were the most common households in this population, with over half being lone persons under 65 years of age. The next largest category was one parent families with dependent children.
 Print Page
 Print All