6306.0 - Employee Earnings and Hours, Australia, May 2014  Quality Declaration
Quality Declaration ARCHIVED ISSUE Released at 11:30 AM (CANBERRA TIME) 22/01/2015
Page tools:
 Print Page Print Page
 Print All Print All
| ||||||||||||||||||||||||||||||||||||||||||||||||||||||||||||||||||||||||||||||||||||||||||||||||||||||||||||||||||||||||||||||||||||||||||||||||||||||||||||||||||||||||||||||||||||||||||||||||||||||||
|
This document was added or updated on 18/01/2017. Analysis of estimates for full-time non-managerial employees paid at the adult rate provides an opportunity to compare earnings and hours paid for by classifications of interest such as sex, method of setting pay, occupation, industry and sector without compositional elements such as the proportion of part-time employees, or employees paid at junior, apprentice or trainee or disability rates. For example, an industry with a large proportion of part-time employees and employees paid at the junior rate will have lower average earnings for all employees than an industry with a small proportion of part-time employees and employees paid at the junior rate. Key results by category In May 2014, there were 5,022,800 full-time non-managerial employees paid at the adult rate of whom 61.1% were male and 38.9% were female. The majority of these employees (95.4%) were employed on a permanent or fixed term basis. Less than one in 20 full-time non-managerial employees paid at the adult rate (4.6%) were casual. Average weekly total cash earnings was $1,509.30 for full-time non-managerial employees paid at the adult rate ($1,625.70 for male employees and $1,326.10 for female employees). For these employees, average weekly total hours paid for was 39.7 hours (40.7 hours for males and 38.3 hours for females). Average hourly total cash earnings was $38.00 for all full-time non-managerial employees paid at the adult rate ($40.00 for male employees and $34.60 for female employees). Occupation Among full-time non-managerial employees paid at the adult rate, Machinery operators and drivers had the highest average weekly total hours paid for (44.3 hours). Clerical and administrative workers had the lowest average weekly total hours paid for (38.1 hours). Professionals had the highest average hourly total cash earnings ($47.60) and Sales workers had the lowest ($29.00). 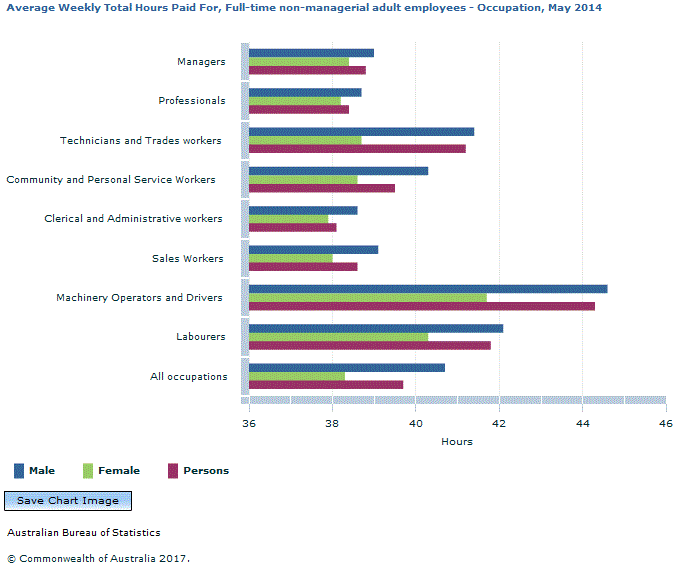 Industry Average weekly total hours paid for was highest in the Mining industry (43.3 hours) and lowest in the Education and training industry (37.7 hours) for full-time non-managerial employees paid at the adult rate. The Mining industry also had the highest average hourly total cash earnings of $56.60. Full-time non-managerial employees paid at the adult rate in the Accommodation and food services industry had the lowest average hourly total cash earnings of $25.90. The Manufacturing industry employed the highest proportion of all full-time non-managerial employees paid at the adult rate (9.9%), followed by the Health care and social assistance industry (9.1%). Sector For full-time non-managerial employees paid at the adult rate, average weekly total hours paid for was higher in the private sector (40.2 hours) than in the public sector (38.3 hours). In contrast, average hourly total cash earnings was higher in the public sector ($42.30) than the private sector ($36.80). Methods Of Setting Pay The most common method of setting pay for full-time non-managerial employees paid at the adult rate was an Individual arrangement (45.4%). The average weekly total cash earnings for these employees was $1,512.50. On average, they were paid for a total of 39.5 hours a week at an average hourly total cash earnings rate of $38.30. The next most common method of setting pay for full-time non-managerial employees paid at the adult rate was Collective agreement (41.8%). These employees had the highest average hourly total cash earnings ($40.40) and were paid for the most total hours per week (40.0 hours). The average weekly total cash earnings for this group of employees was $1,617.20. The least common method of setting pay for full-time non-managerial employees paid at the adult rate was Award only (12.7%). These employees, paid for an average 39.8 weekly total hours, received the lowest average total cash earnings per week ($1,143.00) and per hour ($28.70). DISTRIBUTION OF EARNINGS Weekly total cash earnings, Method of setting pay Median weekly total cash earnings for full-time non-managerial employees paid at the adult rate was $1,319.00. The lowest paid 25% of these employees received $1,010.00 or less in weekly total cash earnings. The next 50% (or inter quartile range) of full-time non-managerial employees paid at the adult rate received weekly total cash earnings between $1,010.00 and $1,780.00. One in 10 full-time non-managerial employees paid at the adult rate received weekly total cash earnings of $838.00 or less, while one in 10 received weekly total cash earnings of $2,372.00 or more. Median weekly total cash earnings for full-time non-managerial employees paid at the adult rate was highest for those paid by collective agreement ($1,468.00) followed by individual arrangement ($1,278.00) and award only ($1,002.00). The inter quartile range for full-time non-managerial employees paid at the adult rate was: between $1,129.00 and $1,888.00 for those paid by collective agreement; between $1,009.00 and $1,770.00 for those paid by individual arrangement; and between $837.00 and $1,302.00 for those employees paid by award only.
(a) Includes registered and unregistered collective agreements. (b) Includes registered and unregistered individual arrangements. (c) Percentiles are based on whole dollars only. Weekly total cash earnings, Occupation by Sex For all full-time non-managerial employees paid at the adult rate, occupation groups with the highest median weekly total cash earnings were Professionals ($1,682.00) and Managers ($1,586.00). 10% of Managers received weekly total cash earnings of $2,904.00 or more, and the highest paid 10% of Professionals received $2,683.00 or more. The occupation groups with the lowest median weekly total cash earnings for full-time non-managerial employees paid at the adult rate were Sales workers ($1,000.00) and Labourers ($1,048.00). One in 10 full-time non-managerial employees paid at the adult rate who were Machinery operators and drivers received weekly total cash earnings of $2,596.00 or more. Ten percent of Technicians and trades workers received weekly total cash earnings of $2,579.00 or more, while one in 10 full-time non-managerial Community and personal service workers paid at the adult rate received $2,033.00 or more. Median weekly total cash earnings for full-time non-managerial employees paid at the adult rate was higher for males ($1,410.00) than females ($1,200.00). The lowest paid 10% of males received weekly total cash earnings of $876.00 or less compared to $798.00 or less for females. The highest paid 10% of male full-time non-managerial employees paid at the adult rate received weekly total cash earnings of $2,598.00 or more compared to $1,988.00 or more for their female counterparts. For male full-time non-managerial employees paid at the adult rate, median weekly total cash earnings was highest for Managers, ($1,809.00) and Professionals ($1,776.00). For females, Professionals had the highest median weekly total cash earnings ($1,596.00). The median weekly total cash earnings was higher for female Managers ($1,195.00) than female Machinery operators and drivers ($1,127.00). Female median weekly total cash earnings was higher at the 90th percentile for Machinery operators and drivers ($2,640.00) than for Managers ($2,579.00). Both male and female median weekly total cash earnings was lowest for Sales workers (males $1,058.00, females $900.00) and Labourers (males $1,080.00, females $918.00). The difference between median weekly total cash earnings for male and female full-time non-managerial employees paid at the adult rate was smallest for Sales workers ($158.00) and Labourers ($162.00) and greatest for Managers ($614.00). 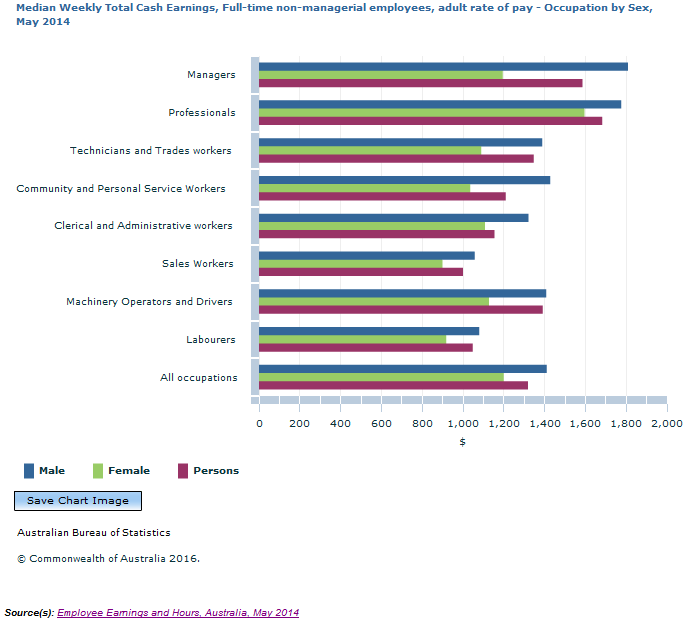 Weekly total cash earnings, Industry Median weekly total cash earnings for all full-time non-managerial employees paid at the adult rate was highest for those employees in the Mining industry ($2,421.00), which was $743.00 higher than for the next highest industry, Electricity, gas, water and waste services ($1,678.00). One in five full-time non-managerial employees paid at the adult rate in the Mining industry received weekly total cash earnings of $3,045.00 or more, higher than in Construction ($2,412.00) and Electricity, gas, water and waste services ($2,388.00). In contrast, industries with the lowest median weekly total cash earnings for all full-time non-managerial employees paid at the adult rate were Retail trade ($958.00) and Accommodation and food services ($974.00). 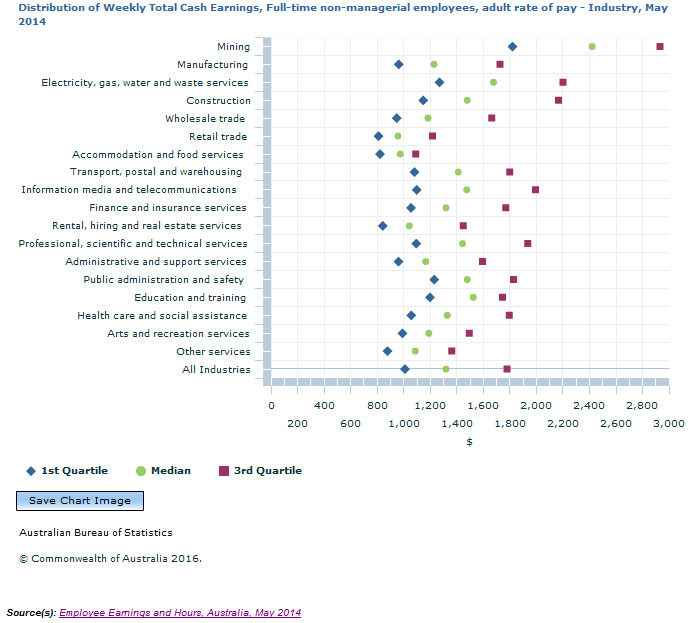 Weekly total cash earnings, Sector Median weekly total cash earnings was higher for full-time non-managerial employees paid at the adult rate in the public sector ($1,532.00) than the private sector ($1,248.00). Earnings for the highest paid 10% were higher in the private sector ($2,406.00) than the public sector ($2,247.00).
(a) Percentiles are based on whole dollars only. Document Selection These documents will be presented in a new window.
|
|||||||||||||||||||||||||||||||||||||||||||||||||||||||||||||||||||||||||||||||||||||||||||||||||||||||||||||||||||||||||||||||||||||||||||||||||||||||||||||||||||||||||||||||||||||||||||||||||||||||
