6105.0 - Australian Labour Market Statistics, July 2013
ARCHIVED ISSUE Released at 11:30 AM (CANBERRA TIME) 10/07/2013
Page tools:
 Print Page Print Page
 Print All Print All
| ||||||||||||||||||||||||||||||||||||||||||||||||||||||||||
|
EXTENDED LABOUR FORCE UNDERUTILISATION RATE Introduction The number of unemployed people and the unemployment rate are both measures that are widely used as indicators of available labour resources which are not currently being utilised in the economy. Despite the high profile of the unemployment rate, no single measure can fully capture the complexity of underutilisation in the labour market. The ABS therefore publishes a number of supplementary measures of labour underutilisation on a regular basis to better inform users about the structure and dynamics of the labour market. The measures are:
The quarterly underemployment and labour force underutilisation rates are both available in Labour Force, Australia (cat. no. 6202.0). The extended labour force underutilisation rate was first released in the Measures of Labour Underutilisation Information Paper, February 2002 (cat. no. 6296.0) and since April 2003 it has been published annually in Australian Labour Market Statistics (cat. no. 6105.0). Extended labour force underutilisation rate components In addition to the unemployed and the underemployed, the extended labour force underutilisation rate includes two groups of people with marginal attachment to the labour force, namely:
Most components of the extended labour force underutilisation rate are sourced from the Labour Force Survey, with the exception of discouraged job seekers. Data on discouraged job seekers are available from the annual Persons Not in the Labour Force supplementary survey currently conducted in September each year. For a more detailed explanation of the calculation of this measure, please see the Extended Labour Force Underutilisation Rate article released in Australian Labour Market Statistics, Jul 2009 (cat. no. 6105.0). 2012 Extended labour force underutilisation rate In August 2012, the extended labour force underutilisation rate was 13.1%. This rate was higher for females than males (15.2% and 11.3% respectively) due to a higher rate of underemployment amongst females than males and a larger number of females than males being marginally attached to the labour force. Table 1 illustrates the various underutilisation rates and populations contributing to the extended labour force underutilisation rate. Table 1
Source: Australian Labour Market Statistics, August 2012 (cat. no. 6105.0) Historically, movements in unemployment have been the primary drivers of movements in the suite of underutilisation measures. In recent years, however, underemployment has had a greater contribution to the broader underutilisation measures. Graph 1 shows the movements between August 1994 and August 2012 for the four measures of labour underutilisation. The pattern of the four measures has been similar since 1994 with the exception of the underemployment rate, which was lower than the unemployment rate between 1994 and 1999. From 2001 to 2008, the unemployment rate gradually decreased while underemployment rate remained steady, and has been consistently higher than the unemployment rate since. The extended labour force underutilisation rate declined between 2001 and 2008, before increasing sharply in 2009 from 10.6% to 14.3%. Since 2009 there has been a steady decline in the rate to 13.1% in 2012. .gif) Footnote(s): (a) Break in series as a result of changes introduced into the Labour Force Survey in April 2001 Source(s): Australian Labour Market Statistics (cat. no. 6105.0) The extended labour force underutilisation rate has been consistently higher for females than males since 1994. In 2012, the difference between the rate for females (15.2%) and males (11.3%) was 3.9 percentage points. The difference was most pronounced in 2003, with a 5.2 percentage point difference (16.6% for females and 11.4% for males).  Footnote(s): (a) Break in series as a result of changes introduced into the Labour Force Survey in April 2001 Source(s): Australian Labour Market Statistics (cat. no. 6105.0) As seen in Graph 3, in August 2012, persons aged 15-19 years had the highest extended labour force underutilisation rate, followed by persons aged 20-24 years. The next four age groups between 25-64 years were very similar with rates at just over 10%. The extended labour force underutilisation rate was higher for females than for males in all the age groups with the exception of those aged 15-19 years ( males 34.4% and females 32.1%). 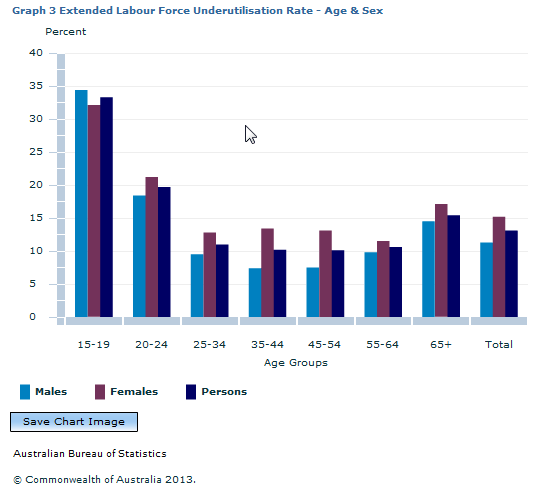 Footnote(s): (a) Break in series as a result of changes introduced into the Labour Force Survey in April 2001 Source(s): Australian Labour Market Statistics (cat. no. 6105.0) STATES AND TERRITORIES Overall differences in the extended labour force underutilisation rate between the states and territories are primarily driven by differences in unemployment and underemployment rates. In August 2012, the lowest underemployment rate of 2.8% was recorded for Northern Territory followed by Western Australia and Australian Capital Territory (5.3% and 5.4% respectively). Australian Capital Territory recorded the lowest unemployment rate in August 2012 of 3.3% followed by 3.8% rate for both Western Australia and Northern Territory. Northern Territory was the only state or territory where the underemployment rate was lower than the unemployment rate. In August 2012, the highest extended labour force underutilisation rate was for Tasmania (18.1%), followed by South Australia (14.6%), Victoria (14.2%) and Queensland (13.8%). All these states had the extended labour force underutilisation rates above the national average (13.1%). Graph 4 shows the four measures of labour underutilisation for all the states and territories and Australia for August 2012. 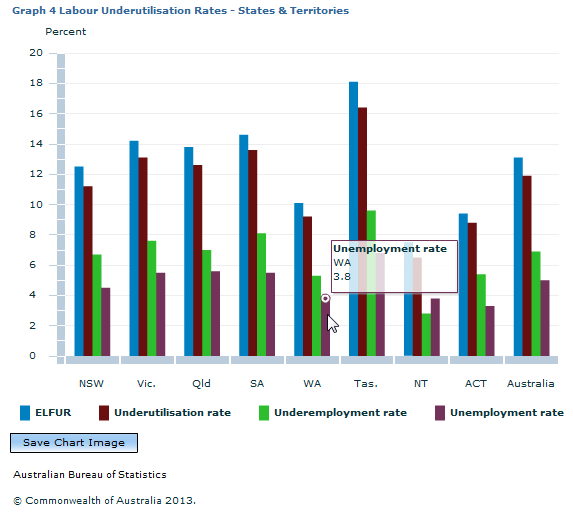 Conclusion While the unemployment rate is the most commonly used measure of available labour supply, it is by no means a comprehensive measure. The ABS produces a range of measures, the broadest being the extended labour force underutilisation rate which takes into account the unemployed, underemployed and some persons marginally attached to the labour force. This broad measure is higher than other measures of labour underutilisation and reflects a greater potential labour supply. For example, in August 2012 the unemployment rate for Australia was 5.0% compared to an underutilisation rate of 11.9% and an extended labour force underutilisation rate of 13.1%, thus giving a more comprehensive picture of the potential labour supply within the economy. End note 1. Discouraged job seekers are defined as people who want to work and could start work within four weeks if offered a job, but whose main reason for not actively looking for work includes the following reasons: considered to be too young or too old by employers; believes ill health or disability discourages employers; lacked necessary schooling, training, skills or experience; difficulties because of language or ethnic background; no jobs in their locality or line of work; no jobs in suitable hours; and no jobs at all. Document Selection These documents will be presented in a new window.
|
|||||||||||||||||||||||||||||||||||||||||||||||||||||||||
