|
|
Reissue
This release corrects textual information in the Summary of Findings in order to support interpretation of a small number of the statistics presented. Tables 6 and 8 have been amended to correct a small number of cells where figures had been transposed or were incorrect. Footnotes have been added to several other tables to aid users in the interpretation of the data.
NOTES
INQUIRIES
For further information about these and related statistics, contact the National Information and Referral Service on 1300 135 070 or Soula Macfarlane on Melbourne (03) 9615 7374.
SUMMARY OF FINDINGS
ABOUT THIS PUBLICATION
Information presented in this publication is about men's and women's experience of physical or sexual assault or threat by male and female perpetrators. PSS respondents were asked about their experiences of the different types of violence, since the age of 15, by different types of male and female perpetrators (including current partner, previous partner, boyfriend/girlfriend or date, other known man or woman, and stranger). More detailed information, such as where the incident occurred and what action was taken, was then collected for most recent incident of each of the different types of violence by a male and female perpetrator. Additional information was also collected about respondents experience of current and previous partner violence such as frequency and fears of violence, incidents of stalking and other forms of harassment and general feelings of safety.
Details regarding the interpretation of these results and comparison with other sources can be found in the Explanatory Notes and Appendix 2: Comparability between PSS and other sources.
MEASURING VIOLENCE
Measuring violence in the community through household surveys is a complex task. It tests people's memories by asking about events that occurred in the past, which may have been traumatic and which may have involved people closely related to them. The accuracy of the statistics can be affected if respondents feel threatened by the act of providing information or if they are concerned that the information might be used against the perpetrator.
Through consultation with experts in the field and testing, the ABS gave attention to the type of information collected and the manner in which it was collected. Special steps were taken to improve the quality of the survey results including detailed and precise questioning and the use of personal interviews. Respondents were informed that the survey was not compulsory and a specific requirement was that interviews were conducted in private, thus ensuring confidentiality of any information disclosed. The use of specially trained interviewers ensured that rapport could be established with respondents and that the relevant concepts and definitions could be explained as necessary.
The ABS publishes data relating to crime from different sources. Different methodologies can affect estimates. For example, incidents recorded by police are different from those reported in household surveys because not all incidents are reported to the police. Also, responses in surveys may be affected by the ways in which questions are asked. Some of these measurement issues are discussed in: Information Paper: Measuring Crime Victimisation, Australia - The Impact of Different Collection Methodologies, 2002 (cat. no. 4522.0.55.00 1). Appendix 2 provides information about the comparability of the PSS with other data sources.
There are no generally agreed or accepted standards for defining what constitutes violence. In developing the concepts and definitions used in the survey, the ABS was assisted by a Survey Advisory Group, which included members with legal and crime research backgrounds. The definitions used were based on actions which would be considered as offences under State and Territory criminal law.
DEFINITION OF VIOLENCE
Violence is any incident involving the occurrence, attempt or threat of either physical or sexual assault. Physical assault involves the use of physical force with the intent to harm or frighten. An attempt or threat to inflict physical harm is included only if a person believes it is likely to be carried out. Sexual assault includes acts of a sexual nature carried out against a person's will through the use of physical force, intimidation or coercion, or any attempts to do this. Unwanted sexual touching is excluded from sexual assault. Sexual threat involves the threat of an act of a sexual nature which the person believes is likely to be carried out. Refer to the Glossary for more detailed definitions.
COMPARISON OVER TIME
This publication includes comparisons with the 1996 Women's Safety Survey (WSS), where relevant. This survey collected information from approximately 6,300 women over the period February to April 1996. It covered the same broad range of topics as the PSS.
Estimates of physical threat appear to have dropped significantly from 1996 to 2005. Care should be taken when comparing estimates of physical threat between the two surveys. The 2005 PSS specifically instructed respondents to exclude incidents of threat that resulted in assault. For the WSS this was not as clearly defined in the question wording and respondents may have reported the same incident under both the physical threat and physical assault questions. This has not impacted on the estimates of physical violence (or total violence) as both physical threat and physical assault were counted only once in the total for physical violence in both the 2005 PSS and the 1996 WSS.
EXPERIENCE OF VIOLENCE
Violence includes any incident involving the occurrence, attempt or threat of either physical or sexual assault.
The following two charts show the experiences of violence for women and men in the 12 months prior to the survey.
In the 12 months prior to the survey, there were an estimated 443,800 (5.8%) women who experienced an incident of violence compared to 808,300 (11%) men. People were three times more likely to experience violence by a man than by a woman.
A larger proportion of men and women experienced physical violence compared to those who experienced sexual violence in the 12 months prior to the survey.
- 4.7% (363,000) of women experienced physical violence compared to 1.6% (126,100) who experienced sexual violence
- 10% (779,800) of men experienced physical violence compared to 0.6% (46,700) who experienced sexual violence
In the 12 months prior to the survey, younger women and men experienced violence at higher rates than older women and men.
- 12% (117,000) of women aged 18-24 years experienced at least one incident of violence, compared to 6.5% (97,900) of women aged 35-44 years and 1.7% (42,100) of women aged 55 years and over
- 31% (304,300) of men aged 18-24 years experienced at least one incident of violence, compared to 9.4% (138,700) of men aged 35-44 years and 2.8% (62,500) of men aged 55 years and over
In the 12 months prior to the survey, a higher proportion of women aged 25 years or more experienced violence, compared to the proportion of men in that age group who experienced violence.
- Of the 808,300 men who experienced violence, 62% (504,100) were aged over 25 years
- Of the 443,800 women who experienced violence, 74% (326,700) were aged over 25 years
Persons who experienced violence, During the last 12 months
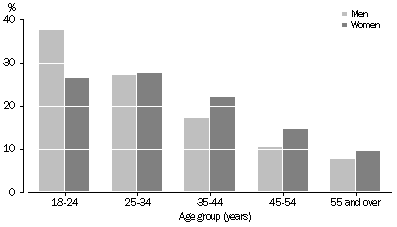
Since the age of 15, there were an estimated 3,065,800 (39.9%) women who experienced violence compared with 3,744,900 (50.1%) men.
- 29% (2,243,600) of women experienced physical assault compared to 41% (3,031,800) of men
- 11% (833,200) of women experienced physical threat compared to 22% (1,675,300) of men
- 17% (1,293,100) of women experienced sexual assault compared to 4.8% (362,400) of men
- 4.6% (353,700) of women experienced sexual threat compared to 0.9% (69,500) of men
Changes over time
A smaller proportion of women reported violence in the 12 months prior to the survey in 2005 than in 1996.
- 5.8% (443,800) of women experienced violence in 2005 compared to 7.1% (490,400) in 1996
- 4.7% (363,000) of women experienced physical violence in 2005, compared with 5.9% (404,400) in 1996
- The proportion of women who experienced physical assault in 2005 was 3.1% (242,000) compared to 5.0% (346,900) in 1996
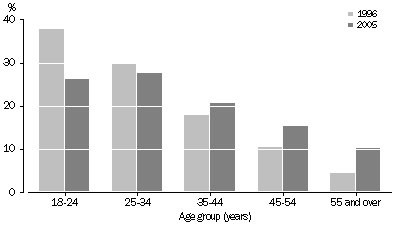
For those women aged less than 35 years, the proportion who experienced physical violence in the 12 months prior to the survey has decreased, while for those aged over 35 years the proportion increased.
- For women aged 18-24 years the proportion decreased to 26% (95,500) in 2005 from 38% (152,500) in 1996
- For women aged 45 years and over the proportion increased in 2005 to 25% (92,100) from 15% (60,500) in 1996
Women's experience of physical violence, During the last 12 months-1996 and 2005
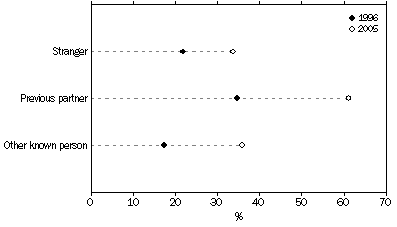
There has been a change in the incidence of violence reported to the police in the 12 months prior to the two survey periods.
- 36% (70,400) of women who experienced physical assault by a male perpetrator reported it to the police in 2005 compared to 19% (54,400) in 1996
- 19% (19,100) of women who experienced sexual assault by a male perpetrator reported it to the police in 2005 compared to 15% (14,700) in 1996
Women's experience of physical assault by a male perpetrator, Police told, During the last 12 months-1996 and 2005
FEELINGS OF SAFETY
Feelings of safety refer to a respondent's feelings of safety in selected situations when they are alone.
Over the last 10 years, women's feelings of safety in selected situations have increased.
- 15% (1,165,400) of women in 2005 felt safe using public transport alone after dark compared to 11% (721,600) in 1996
- Of those who did not use public transport alone after dark in 2005, 25% (1,477,000) did not use it because they felt unsafe compared to 30% (1,737,500) in 1996
HARASSMENT
Harassment includes incidents such as obscene phone calls, indecent exposure, inappropriate comments about body or sex life and unwanted sexual touching.
- In the 12 months prior to the survey, 12% (864,300) of men experienced some form of harassment compared to 19% (1,459,500) of women
- Since the age of 15, 42% (6,333,400) of persons experienced harassment
- Since the age of 15, 33% (2,499,100) of women experienced inappropriate comments about their body or sex life compared to 12% (871,000) of men
- Since the age of 15, 25% (1,931,100) of women experienced unwanted sexual touching compared to 9.9% (737,000) of men
STALKING
Stalking involves various activities, such as loitering and following, which the respondent believed were being undertaken with the intent to harm or frighten. To be classified as stalking more than one type of activity had to occur, or the same type of activity had to occur on more than one occasion.
Younger people were more likely to be stalked than older people.
- In the 12 months prior to the survey, 28% (31,000) of men and 31% (61,300) of women who experienced stalking were aged 18-24 compared to 11% (12,500) of men and 8.8% (17,200) of women aged 55 years or older
- Since the age of 15, 9.1% (681,700) of men have been stalked (this includes incidents that occurred more than 20 years ago) compared to 19% (1,472,300) of women
PHYSICAL VIOLENCE
Physical violence includes any incident involving the occurrence, attempt or threat of physical assault. Physical assault involves the use of physical force with the intent to harm or frighten. An attempt or threat to inflict physical harm is included only if a person believes it is likely to be carried out.
In the 12 months prior to the survey period, 10% (779,800) of men and 4.7% (363,000) of women experienced physical violence.
An estimated 35% (5,275,400) of men and women have experienced physical assault since the age of 15.
The overall experiences of physical assault for men and women, in the 12 month period prior to the survey were different.
- Of those men who were physically assaulted, 65% (316,700) were physically assaulted by a male stranger compared to 15% (35,500) of women who were physically assaulted by a male stranger
- Of those women who were physically assaulted, 31% (73,800) were physically assaulted by a current and/or previous partner compared to 4.4% (21,200) of men who were physically assaulted by a current and/or previous partner
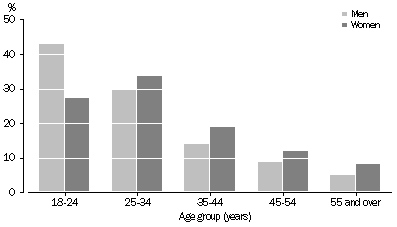
- 43% (207,100) of men who were physically assaulted were aged 18-24 years compared to 27% (65,800) of women
Experience of physical assault, During the last 12 months
Men were more likely to be physically assaulted by a stranger in the most recent incident since the age of 15, whereas women were more often assaulted by a current and/or previous partner.
- Of those men who were physically assaulted, 65% (1,507,400) were assaulted by a male stranger
- Of those women who were physically assaulted, 46% (780,500) were assaulted by a current and/or previous partner
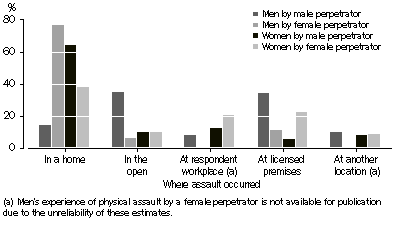
The location of assaults varied between women and men during the 12 months prior to the survey
- Of the 195,300 women who experienced physical assault by a male perpetrator, 64% (125,100) of incidents occurred in a home
- Of the 79,500 men who experienced physical assault by a female perpetrator, 77% (60,900) of incidents occurred in a home
- Of those women who experienced physical assault by a female perpetrator, 38% (25,300) were assaulted in a home and 22.7% (15,100) at licensed premises
- 35% (148,900) of men experienced physical assault by a male perpetrator in the open, and 34% (145,300) at licensed premises
Location of physical assault, Most recent incident, during the last 12 months
SEXUAL VIOLENCE
Sexual violence includes sexual assault and sexual threat. Sexual assault is defined as an act of a sexual nature carried out against a person's will. Sexual threats are threats of sexual assault which a person believed were likely to be carried out.
During the 12 months prior to the survey 1.6% (126,100) of women and 0.6% (46,700) of men experienced an incident of sexual violence.
- Of the women who experienced sexual violence 81% (101,600) experienced an incident of sexual assault and 28% (34,900) experienced a threat of sexual assault
- 22% (22,100) of women had experienced sexual assault by a stranger in the most recent incident, 21% (21,500) by a previous partner, 39% (39,700) by a family member or friend and 32% (32,500) by an other known person
In the 12 months prior to the survey, 0.6% (42,300) of men reported experiencing sexual assault.
- 44% (18,500) had experienced sexual assault by a family member or friend in the most recent incident, 35% (14,900) by an other known person, and 33% (13,900) by a stranger
Since the age of 15, 5.5% (408,100) of men reported experiencing sexual violence compared to 19% (1,469,500) of women.
VIOLENCE BY CURRENT PARTNERS
People who experienced violence from their current partner were more likely to experience physical, rather than sexual, violence.
- Since the age of 15, 0.9% (68,100) of men and 2.1% (160,100) of women experienced current partner violence
- 10% (16,100) of women who had experienced violence by their current partner had a violence order issued against their current partner as a result of the violence. Of those women who had violence orders issued, 20% (3,200) reported that violence still occurred
Violence which occurs between partners in a home may affect the children who also live in the home.
- 49% (111,700) of men and women who experienced violence by a current partner reported that they had children in their care at some time during the relationship. An estimated 27% (60,700) said that these children had witnessed the violence
VIOLENCE BY PREVIOUS PARTNERS
Since the age of 15, people were more likely to have experienced violence from a previous partner than from a current partner.
- 4.9% (367,300) of men experienced violence from a previous partner compared to 15% (1,135,500) of women
- 32% (368,300) of women and 40% (146,500) of men who had ever experienced violence by their previous partner said there had only been one incident
- 59% (667,900) of women who experienced violence by a previous partner were pregnant at some time during the relationship; of these, 36% (239,800) reported that violence occurred during a pregnancy and 17% (112,000) experienced violence for the first time when they were pregnant
- 61% (822,500) of persons who experienced violence by a previous partner reported that they had children in their care at some time during the relationship and 36% (489,400) said that these children had witnessed the violence
CHILD PHYSICAL AND SEXUAL ABUSE
Child physical abuse includes any deliberate physical injury (including bruises) inflicted on a child, before the age of 15, by an adult. Child sexual abuse is any act, by an adult, involving a child under the age of 15 years in sexual activity.
- The proportion of women and men who experienced physical abuse before the age of 15 was 10% (779,500) and 9.4% (702,400) respectively
- Women were more likely to have been sexually abused than men. Before the age of 15, 12% ( 956,600) of women had been sexually abused compared to 4.5% (337,400) of men
|
|
 Print Page
 Print All