SUMMARY OF FINDINGS
INTRODUCTION
The 2004-05 National Aboriginal and Torres Strait Islander Health Survey (NATSIHS) is the largest health survey of Indigenous Australians conducted by the Australian Bureau of Statistics (ABS). The sample size was 10,439 persons (or about one in 45 of the total Indigenous population), considerably larger than the supplementary Indigenous samples in the 1995 and 2001 National Health Surveys (NHS(I)). This survey, which was conducted in remote and non-remote areas throughout Australia, was designed to collect a range of information from Indigenous Australians about health related issues, including health status, risk factors and actions, and socioeconomic circumstances.
The survey aims were to:
- provide broad information about the health of Indigenous Australians, by remoteness, and at the national and state/territory levels;
- allow for the relationships across the health status, risk factors and health related actions of Indigenous Australians to be explored;
- provide comparisons over time in the health of Indigenous Australians; and
- provide comparisons with results for the non-Indigenous population from the 2001 and 2004-05 National Health Survey (NHS).
It should be noted that all results presented in this publication are based on information reported by respondents and may therefore differ from information collected using other methods or sources. For further information on data quality refer to the Explanatory Notes and the Technical Note.
This summary of findings represents only some of the insights that can be obtained from the 2004-05 NATSIHS. Readers interested in undertaking further analysis of the data are referred to the National Health Survey and the National Aboriginal and Torres Strait Islander Health Survey 2004-05: Data Reference Package (cat. no. 4363.0.55.002) available on the ABS web site <www.abs.gov.au> or on request from the contact officer listed at the front of this publication.
POPULATION CONTEXT
The Aboriginal and Torres Strait Islander population at 30 June 2001 was estimated to be 458,500, or 2.4% of the total Australian population. In the 2001 Census of Population and housing, 96% of Indigenous people were counted in private dwellings and 4% in non-private dwellings such as hotels/motels, health care facilities and correctional institutions. The Indigenous population in private dwellings was projected for the survey to be 474,310 at 31 December 2004, around the midpoint of the 2004-05 NATSIHS enumeration period.
In 2001, around 90% of the Indigenous population were identified as being of Aboriginal origin, 6% were identified as being of Torres Strait Islander origin and 4% were identified as being of both Aboriginal and Torres Strait Islander origin. Around one in four Indigenous people (26%) were living in remote areas compared with only one in fifty non-Indigenous people (2%).
In 2001, the largest proportions of the Indigenous population were living in New South Wales (134,900 people or 29% of the total Indigenous population), Queensland (125,900 people or 27%) and Western Australia (65,900 people or 14%). Indigenous people in 2001 represented less than 4% of the total populations in all states and territories, except the Northern Territory where they comprised 29% of the population.
The Indigenous population is relatively young, with a median age of 21 years compared to 36 years for the non-Indigenous population. As age is closely associated with health, care should be taken when comparing information for these two populations. To account for differences in the age structure, comparisons between Indigenous and non-Indigenous people are presented by age group or by using age standardised rates as appropriate. For further information on the size, structure and distribution of the Indigenous population, see Population Characteristics, Aboriginal and Torres Strait Islander Australians, 2001 (cat. no. 4713.0).
HEALTH STATUS
Self assessed health
Self assessed health status provides an indicator of overall health; it reflects an individual's perception of his or her own health. This measure is dependent on an individual's awareness and expectations regarding their health, and may be influenced by factors such as access to health services and health information.
In 2004-05, just over three-quarters (78%) of the Indigenous population reported their health as either good, very good or excellent (similar to the 77% recorded in the 2002 National Aboriginal and Torres Strait Islander Social Survey (NATSISS) and up slightly on the 73% recorded in the 2001 NHS(I)) and 22% reported their health as fair or poor (consistent with 23% in the 2002 NATSISS) (table 1 and the National Aboriginal and Torres Strait Islander Social Survey 2002, cat. no. 4714.0).
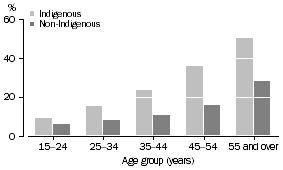
Self assessed health is shown to vary with age. The proportion of people aged 15-24 years reporting fair or poor health was 9%, compared with 50% of people aged 55 years and over (table 7). After adjusting for differences in age structure between the Indigenous and non-Indigenous populations, Indigenous people overall were almost twice as likely as non-Indigenous people to report their health as fair or poor (table 6). This relative difference is apparent across most broad age groups (table 7).
fair or poor self assessed health, Persons aged 15 years and over
Social and emotional wellbeing
The 2004-05 NATSIHS collected information on the social and emotional wellbeing of Indigenous adults (aged 18 years and over) using selected questions from the SF-36 and the Kessler Psychological Distress Scale. Questions were also asked regarding feelings of anger, the impact of psychological distress, stressors, and cultural identification. As this was the first time that these types of questions were asked as part of an ABS Indigenous survey, further analytical work is being undertaken to assess their suitability for understanding wellbeing for Indigenous people (see Glossary/Explanatory Notes for more information).
In response to questions (from the SF-36) about feelings of happiness and energy levels, more than half the adult Indigenous population reported being happy (71%), calm and peaceful (56%), and/or full of life (55%) all or most of the time, while just under half (47%) said they had a lot of energy all or most of the time. Indigenous people in remote areas were more likely to report having had these positive feelings all or most of the time, than were Indigenous people living in non-remote areas (table 11).
Responses to questions from the Kessler Psychological Distress Scale showed that almost one in ten Indigenous adults (9%) reported feeling nervous all or most of the time. When asked how often they felt without hope, 7% said that they had this feeling all or most of the time. Similarly, 7% said that they felt so sad that nothing could cheer them up, all or most of the time. A higher proportion of the Indigenous population reported feeling restless (12%) and/or that everything was an effort all or most of the time (17%) (table 12).
Long term health conditions
Around two-thirds (65%) of Indigenous people reported at least one long term health condition. Indigenous people in remote areas were less likely to report a long term health condition than those in non-remote areas (57% compared with 68%) (table 1).
The proportion of Indigenous people with at least one long term health condition varied markedly with age, from 44% of Indigenous children aged 0-14 years to 97% of older Indigenous people (aged 55 years and over). The reporting of multiple conditions also varied with age - with 9% of children aged 0-14 years compared to 79% of older Indigenous people reporting more than one long term condition (table 9).
Number of long term health conditions, Indigenous persons
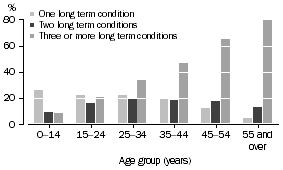
A higher proportion of Indigenous Australians than non-Indigenous Australians reported more than one long term health condition in age groups between 25-54 years. Young people (aged 0-24 years) and older people (aged 55 years and over) in both populations had similar rates (table 9).
After adjusting for age differences between the two populations, Indigenous and non-Indigenous Australians were equally likely to report a long term health condition (table 6).
Consistent with results from the 2001 survey, eye/sight problems (30%), asthma (15%), back and disc disorders (13%), heart/circulatory diseases (12%) and ear/hearing problems (12%) were the most commonly reported long term health conditions among Aboriginal and Torres Strait Islander people in 2004-05. In addition, 6% of Indigenous people reported diabetes and 2% reported kidney disease (table 1).
Results from the 2004-05 NATSIHS show that high proportions of Indigenous adults who reported a long term condition reported stressors experienced by themselves, family or friends (including death of a family member or close friend, alcohol and drug problems, divorce or separation, and discrimination/racism). For example, 81% of those with kidney disease, 77% of those with back problems and 75% of those with diabetes reported a stressor (other than serious illness or disability). Of adults who did not report a long term condition, 65% had also experienced a stressor (other than serious illness or disability) (table 10).
Asthma
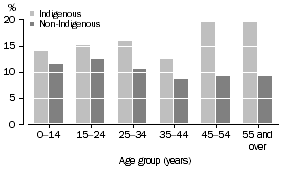
Consistent with results from 2001, asthma was reported by around one in seven Indigenous Australians (15%) in 2004-05 (table 1). After adjusting for age differences between the two populations, Indigenous people were 1.6 times more likely to report asthma as a long term health condition than were non-Indigenous people (table 6). Within the Indigenous population, asthma was reported almost twice as often in non-remote areas (17%) as in remote areas (9%) (table 1).
Asthma was most prevalent for Indigenous people aged 45 years and over (19%). For the younger age groups the prevalence of asthma ranged from 12% to 16% (table 9).
Prevalence of asthma
Heart and circulatory problems/diseases
In 2004-05, around one in eight Indigenous Australians (12%) reported a long term health condition associated with the circulatory system, such as heart disease or hypertensive disease, consistent with the 11% reported in 2001. In 2004-05, these long term conditions were more prevalent in remote (14%) than non-remote (11%) areas (table 1). After adjusting for age differences between the two populations, Indigenous people were 1.3 times more likely than non-Indigenous people to report heart disease and/or circulatory problems (table 6).
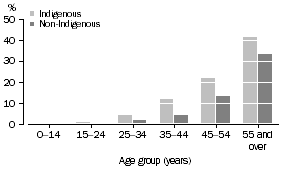
Heart and circulatory diseases/problems tend to develop over the course of a lifetime. Results from the 2004-05 NATSIHS show a marked increase in the prevalence of these conditions among Indigenous people from around 35 years of age onwards, some 10 years earlier than in the non-Indigenous population. Within the Indigenous population, the rate for people aged 35-44 years (21%) was almost double the rate for those aged 25-34 years (11%). More than half (54%) of those aged 55 years and over reported heart and circulatory problems/disease (table 9).
Hypertensive disease (high blood pressure) was the most commonly reported heart and circulatory condition among Aboriginal and Torres Strait Islander people in 2004-05, affecting 22% of those aged 35 years and over (table 9 and Technical Note: table 2). Overall, there was no change in the reported level of hypertensive disease between 2001 and 2004-05 (7%) (table 8).
prevalence of Hypertensive disease
Hearing loss and diseases of the ear
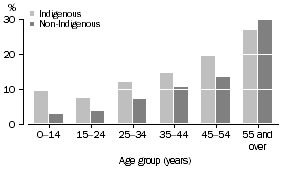
Around one in eight Aboriginal and Torres Strait Islander people (12%) reported ear diseases and/or hearing problems in 2004-05, compared to 15% reported in 2001 (table 1). The 2004-05 rate is consistent with reporting by non-Indigenous people in the NHS (13%) (table 9 and Technical Note: table 1). Rates of hearing loss were higher among Indigenous people than non-Indigenous people in all age groups up to 55 years of age. The prevalence of ear/hearing problems, including total/partial hearing loss and otitis media (middle ear infection), was much higher among Indigenous children aged 0-14 years (10%) than non-Indigenous children (3%) (table 9).
Prevalence of hearing loss/diseases of the ear
Diabetes
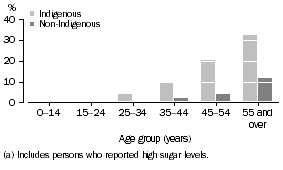
Diabetes (including high sugar levels) continues to be a significant health issue among Indigenous Australians, with an overall prevalence of 6% in 2004-05 (table 1). After adjusting for age differences between the two populations, Indigenous people were more than three times as likely as non-Indigenous people to report some form of diabetes (table 6).
Consistent with results from 2001, diabetes was almost twice as prevalent among Indigenous people in remote areas (9%) as it was in non-remote areas (5%) in 2004-05 (table 1). For diabetes, the pattern of onset by age is very similar to that for hypertensive disease, increasing markedly from around 35 years of age onwards and with a prevalence of 32% for Indigenous Australians aged 55 years and over (table 9).
prevalence of diabetes(a)
Kidney Disease
The 2004-05 NATSIHS collected information from private dwellings only and not from health care facilities. Since the treatment of kidney disease accounts for around one-third of all hospital admissions of Indigenous people (see The Health and Welfare of Australia's Aboriginal and Torres Strait Islander Peoples 2005, ABS cat. no. 4704.0) and persons in hospital are not in scope of the NATSIHS, results may underestimate the prevalence of kidney disease in the Indigenous population.
In 2004-05, kidney disease was reported by 2% of Indigenous people overall (3% in remote areas and 1% in non-remote areas) (table 1). Kidney disease increased with age, from less than 1% of Indigenous children aged 0-14 years to 7% of Indigenous Australians aged 55 years and over (table 9).
Prevalence of kidney disease
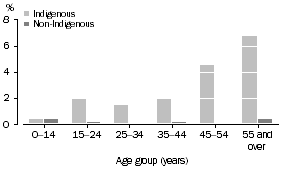
After adjusting for age differences, rates of kidney disease were much higher in the Indigenous population than in the non-Indigenous population (table 6).
HEALTH RELATED ACTIONS
An individual's health related actions, and access to health professionals and services are important factors in the successful prevention and management of health conditions. Apart from visits to a dentist, Indigenous people were more likely than non-Indigenous people to have taken at least one of the surveyed health related actions in 2004-05 (table 6).
Hospital admissions
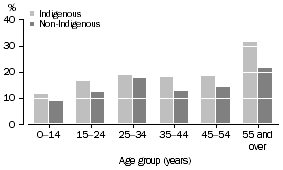
Around one in six Indigenous people (16%) had been admitted to hospital in the 12 months prior to the 2004-05 survey (table 1). After adjusting for age differences between the two populations, Indigenous people were 1.3 times more likely than non-Indigenous people to have been hospitalised in the 12 months prior to interview (table 6). Indigenous Australians were admitted to hospital more often than non-Indigenous Australians across all age groups (apart from people aged 25-34 years where rates were similar). Hospital admissions were most common among older Indigenous people (aged 55 years and over) at 31% (table 14).
Hospital admissions in last 12 months
Consultations with health professionals
In 2004-05, the rates of consultation by Indigenous people with health professionals were similar to those reported in 2001. One in five Indigenous people (20%) reported having visited a doctor (GP or specialist) in the two weeks prior to interview, 17% had consulted an 'other' health professional (e.g. Aboriginal health worker or nurse), 5% had visited the casualty or outpatients department of a hospital, and 4% (of people aged two years and over) had seen a dentist. The proportion of Indigenous Australians consulting health professionals was higher among the older age groups (table 15). Indigenous people in remote areas were around twice as likely as those in non-remote areas to have consulted an Aboriginal health worker, nurse or other health professional (27% compared with 14%) (table 1).
Consultations with health professionals(a), Indigenous persons
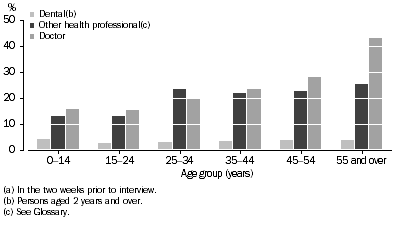
After adjusting for age differences between the two populations, Indigenous people were equally as likely as non-Indigenous people to have visited a doctor, one-and-a-half times more likely to have consulted an 'other' health professional and more than twice as likely to have visited the casualty or outpatients department of a hospital in the two weeks before the survey. Indigenous people were around half as likely as non-Indigenous people to have seen a dentist during that period (table 6).
Oral health
In the 2004-05 NATSIHS, the ABS collected information for the first time about the oral health of Indigenous people, in addition to the information on recent visits to health professionals. Of Indigenous people aged 15 years and over, 11% had never visited a dentist or other health professional about their teeth. This proportion was 24% for Indigenous people in remote areas compared with 6% in non-remote areas (table 15).
While more than three-quarters (78%) of all Indigenous people aged 15 years and over had lost fewer than five adult teeth in their lifetime, the proportion who had lost five or more teeth ranged from around 1% of people aged 15-24 years to 61% of those aged 55 years and over. Of people aged 55 years and over, almost half (47%) had lost 10 or more adult teeth. While older people in non-remote areas reported a higher level of tooth loss and greater use of dentures than those in remote areas, a higher proportion of people aged 55 years and over in remote areas (19%) than in non-remote areas (10%) said they required dentures but did not have them (table 15).
HEALTH RISK FACTORS
Smoking
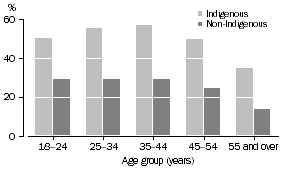
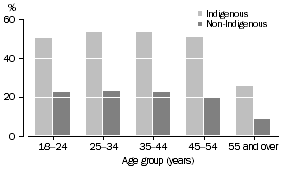
In 2004-05, half the adult Indigenous population (50%) were current daily smokers, that is, people who smoked one or more cigarettes per day, on average. ABS health surveys record little change in the rate of smoking by Indigenous people since 1995 (table 1). For both men and women, smoking was more prevalent among Indigenous than non-Indigenous adults in every age group (table 18).
Current daily smokers, Males
 Current daily smokers, Females
After adjusting for age differences between the two populations, Indigenous adults were still more than twice as likely as non-Indigenous adults to be current daily smokers (table 6).
Alcohol consumption
In 2004-05, around half of all Indigenous adults (49%) reported having consumed alcohol in the week prior to interview, of whom one-third (16%) reported drinking at risky/high risk levels (table 17). When compared with results from 2001, the proportion of Indigenous adults who reported drinking at risky/high risk levels in 2004-05 was about three percentage points higher overall (five points higher in non-remote areas and two points lower in remote areas) (table 1). After adjusting for age differences, the proportion of Indigenous adults who reported drinking at risky/high risk levels (15%) was similar to that of non-Indigenous adults (14%) (table 6). For information on alcohol risk levels, see Glossary.
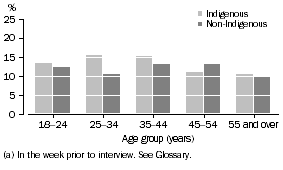
The patterns of risky/high risk alcohol consumption were different for men and women. A higher proportion of Indigenous men than women had consumed alcohol at risky/high risk levels in the week before the survey, except among those aged 55 years and over where the rate was similar for males and females, at about 10%. Indigenous women had their highest rates of risky/high risk consumption at an earlier age (25-34 years) than Indigenous men (35-44 years). The highest rate of risky/high risk consumption for non-Indigenous women also occurred for a lower age group (35-44 years) than for men (45-54 years) (table 19).
Risky/high risk alcohol consumption(a), Males
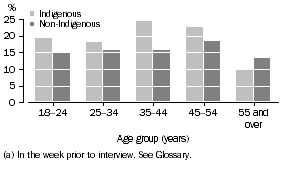 Risky/high risk alcohol consumption(a), Females
Substance use
Illicit substance use can be divided into two categories: use of substances which are illegal to possess (e.g. heroin) and non-medical use of substances which are legally available (e.g. petrol inhalation and misuse of prescription drugs). Information on illicit substance use by Indigenous people aged 15 years and over in non-remote areas is available from both the 2004-05 NATSIHS and the 2002 NATSISS.
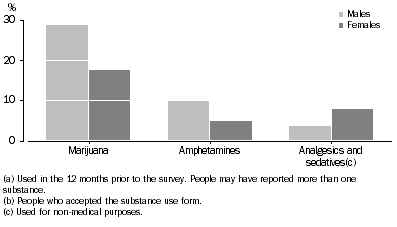
For Indigenous people aged 18 years and over who accepted the substance use form, reported rates of illicit substance use (in the 12 months prior to the survey) were 25% in 2002 and 28% in 2004-05 (table 20). In addition, in 2004-05 a further 22% reported illicit substance use at least once in their lifetime. The substances most commonly used in the last 12 months were marijuana (23%), amphetamines (7%) and analgesics/sedatives (for non-medical purposes) (6%) (table 20).
Selected illicit substances(a), Indigenous persons aged 18 years and over in non-remote areas(b)
Diet and exercise
Many of the principal causes of ill-health among Aboriginal and Torres Strait Islander people are nutrition related diseases, such as heart disease, Type II diabetes and renal disease (see The Health and Welfare of Australia's Aboriginal and Torres Strait Islander Peoples 2005, ABS cat. no. 4704.0). While a diet high in saturated fats and refined carbohydrates increases the likelihood of developing these diseases, regular exercise and intake of fibre-rich foods, such as fruit and vegetables, can have a protective effect against disease. The National Health and Medical Research Council guidelines recommend a minimum of five serves of vegetables per day and two serves of fruit per day. For more information, see Glossary.
Fruit and vegetables
In 2004-05, the majority of Indigenous people aged 12 years and over reported eating vegetables (95%) and/or fruit (86%) daily (table 22). Fruit and vegetables may be less accessible to Indigenous people in remote areas, of whom one in five (20%) reported no usual daily fruit intake compared with one in eight (12%) in non-remote areas. The disparity was even greater for vegetables, where 15% of people in remote areas reported no usual daily intake compared with 2% in non-remote areas (table 1). Of people in non-remote areas, 42% were eating the recommended daily intake of fruit and 10% the recommended daily intake of vegetables (table 23 and Technical Note: table 2). Indigenous people in remote areas were not asked to specify how many serves of vegetables or fruit they usually ate on a daily basis.
In non-remote areas, the intake of vegetables was broadly similar between Indigenous and non-Indigenous people. Indigenous people generally reported eating less fruit than non-Indigenous people (table 23).
Salt and milk
In 2004-05, around seven in ten Indigenous people either sometimes (25%) or usually (46%) added salt after cooking. Indigenous people in remote areas (83%) were more likely than those in non-remote areas (65%) to report sometimes or usually adding salt after cooking (table 22).
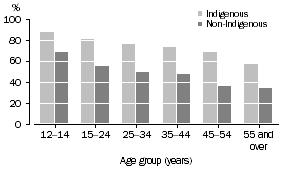
Over three-quarters (79%) of Indigenous people usually drank whole (full cream) milk in 2004-05, with 16% reporting reduced fat or skim milk. Those in remote areas (87%) were more likely to drink whole milk (including full cream powdered milk) than those living in non-remote areas (76%) (table 22). In non-remote areas, Indigenous people were much more likely to drink full cream milk than non-Indigenous people, regardless of age (table 23).
Whole milk consumption in non-remote areas
Exercise
The 2004-05 NATSIHS collected information relating to the frequency, intensity and duration of exercise undertaken by Indigenous Australians living in non-remote areas. The proportion of Indigenous people in non-remote areas who were sedentary or engaged in low level exercise in the two weeks prior to interview was higher in 2004-05 (75%) than in 2001 (68%) (table 1).
Body mass
The proportion of people that are overweight or obese within a given population can be determined by first calculating an individual's Body Mass Index (BMI) score (from reported information on height and weight) and then grouping people into BMI categories. In the 2004-05 NATSIHS and NHS, self reported height and weight measurements were collected for people aged 15 years and over. An option to have height and weight measured was provided in some remote areas. Height and weight information could not be obtained for 17% of Indigenous people and 8% of non-Indigenous people (table 21 and Technical Note: table 2). For more information on the BMI, see Glossary.
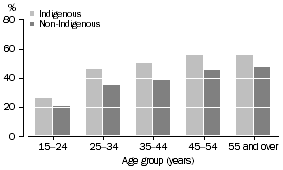
Just under one-third (31%) of Indigenous people aged 15 years and over were recorded as being in the normal or healthy weight range in 2004-05, with a further 23% in the overweight category and 24% classified as obese (table 21 and Technical Notes: table 2). After adjusting for non-response, the proportion of Indigenous people in non-remote areas who were overweight or obese in 1995 was 48% increasing to 56% in 2004-05, although this difference was not statistically significant (table 1). After adjusting for age differences between the two populations and non-response, Indigenous Australians were 1.2 times more likely to be overweight/obese than non-Indigenous Australians (table 6). In each age group the disparity between Indigenous and non-Indigenous people was greater for females than for males (table 21).
Overweight/obese, Males
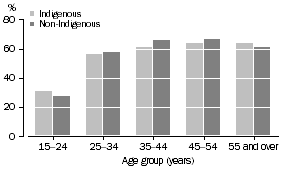 Overweight/obese, Females
Breastfeeding
In 2004-05, the majority of Indigenous women aged 18-64 years who had had children, reported having breastfed them (84%), consistent with results from 2001 (86%). The proportion of women who breastfed their children was higher in remote areas (92%) than non-remote areas (80%) (table 27). Similarly, 79% of Indigenous children under four years of age had been breastfed for at least some period, of which 13% were being breastfed at the time of the survey (table 24).
Immunisation
Early childhood immunisation
In 2004-05, around nine in ten Indigenous children under seven years of age in non-remote areas were reported as being fully immunised against diphtheria, tetanus, whooping cough, polio, hepatitis B, measles, mumps, rubella and haemophilus influenza type B (HIB). Among children for whom immunisation records were available, vaccination rates ranged from 73% for HIB to 85% for the combined Measles/Mumps/Rubella vaccine (table 26).
Immunisation of older people
In addition to information on a range of early childhood vaccinations, the 2004-05 NATSIHS also collected data on vaccinations against influenza and pneumonia among Indigenous people aged 15 years and over. These vaccinations are especially targeted at older people.
More than half (60%) of Indigenous people aged 50 years and over reported that they had been vaccinated for influenza in the 12 months before the survey and 34% for pneumonia in the last five years. Older Indigenous people in remote areas were more likely (80%) than those in non-remote areas (52%) to have been recently vaccinated for influenza, and were more than twice as likely to have received a vaccination against pneumonia (56% compared with 26%) (table 25).
WOMEN'S HEALTH
Information on mammograms has been collected for Indigenous women aged 18 years and over in both the 2001 and 2004-05 surveys. While the proportion of Indigenous women aged 40 years and over reporting regular mammograms was lower in 2004-05 (32%) than in 2001 (39%), this difference was not statistically significant (table 27).
Consistent with results from 2001, just over half of Indigenous women aged 18 years and over reported having had regular pap smear tests (52% in 2004-05 and 53% in 2001). Over this period, the proportion of women who reported regular pap smear tests increased in remote areas (from 56% to 65%) and decreased in non-remote areas (from 52% to 47%, although this difference is not statistically significant) (table 27).
Contraception
Reported use of common contraceptives by Indigenous women aged 18-49 years has changed very little since 2001. In 2004-05, condoms (21%) were most commonly reported, followed by the contraceptive pill (14%) and contraceptive injection (DepoProvera) (8%). In addition, 13% of Indigenous women in remote areas and 5% of those in non-remote areas reported using a contraceptive implant (Implanon), which can prevent pregnancy for up to three years (table 27).
 Print Page
 Print All