TECHNICAL NOTE 2: IMPROVEMENTS TO MORTALITY ESTIMATION AT THE HIGHEST AGES, 2010-2012
Advice regarding mortality at the highest ages
1 In recent years, the ABS has received advice from a range of mortality data experts that Australia’s official life tables have traditionally underestimated mortality rates and, as a consequence, overestimated life expectancy at the highest ages (90 years and over). This feature of Australian data has been highlighted through comparisons with countries with similar mortality characteristics, such as New Zealand, Canada and Japan.
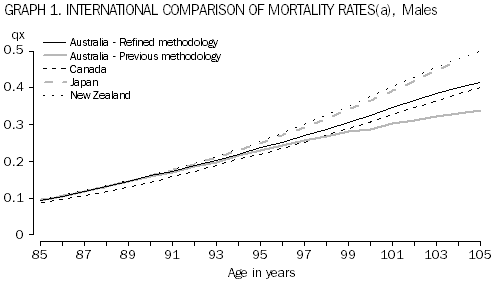
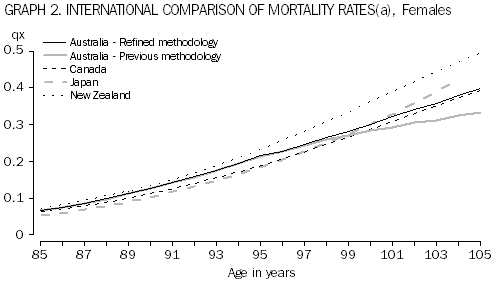
2 Mortality rates show considerable year-to-year variability at the highest ages, given the relatively small numbers of deaths and persons in these very old ages. A degree of smoothing is always required, though a recent investigation by the ABS confirmed that the smoothing should not have been done to the extent that had been done previously. As can be seen in the following graphs, Australian mortality rates (qx values) for males and females based on the previous method are lower or ‘smoother’ than for the other comparable countries.

Footnote(s): (a) All data used are from 2012 except for Canada which used 2011 data.
Sources: Abridged Life Tables for Japan 2012, http://www.mhlw.go.jp/english/database/db-hw/lifetb12/dl/lifetb12-05.pdf - accessed 17 October 2013
Life Tables, Canada, Provinces and Territories,
2009 to 2011 http://www.statcan.gc.ca/pub/84-537-x/84-537-x2013005-eng.pdf - accessed 17 October 2013
Abridged period life table, 2010-12, New Zealand, http://www.stats.govt.nz/searchresults.aspx?q=life%20tables - accessed 17 October 2013
Methodological improvement
3 After investigating the issue in detail, the ABS made a small refinement to the life tables methodology, which was implemented for the 2010-12 tables. Graduation of the qx values was again undertaken for the 2010-2012 life tables, but not to the same degree as in previous years. This resulted in qx values being a little higher than they would have been under the former methodology and has now brought data for Australia in line with that for other comparable countries.
Statistical impacts
4 The ABS estimated that refining the methodology used to estimate mortality rates at the highest ages in Australia resulted in an estimate of life expectancy at birth around 0.02 years lower (for both males and females) than the previous method. In order to derive an estimate of the impact of the methodological change, the ABS developed national life tables on both methodological bases and contrasted the estimates.
TABLE 1. COMPARISON OF LIFE EXPECTANCY AT BIRTH,
Two methodologies, Australia - 2010-2012 |
|
 | Life expectancy at birth, 2010-2012 - refined methodology | Life expectancy at birth, 2010-2012 - previous methodology |
|
| Males | 79.87 | 79.90 |
| Females | 84.25 | 84.27 |
|
5 This difference was greater for life expectancy at the older ages; around 0.03 years at 75 for both males and females, and 0.10 years at 90 for males and 0.05 years for females.
TABLE 2. COMPARISON OF LIFE EXPECTANCY AT 75,
Two methodologies, Australia - 2010-2012 |
|
 | Life expectancy at 75, 2010-2012 - refined methodology | Life expectancy at 75, 2010-2012 - previous methodology |
|
| Males | 11.70 | 11.73 |
| Females | 13.84 | 13.87 |
|
TABLE 3. COMPARISON OF LIFE EXPECTANCY AT 90,
Two methodologies, Australia - 2010-2012 |
|
 | Life expectancy at 90, 2010-2012 - refined methodology | Life expectancy at 90, 2010-2012 - previous methodology |
|
| Males | 4.30 | 4.40 |
| Females | 4.89 | 4.94 |
|
6 While the impact of this change on life expectancy has been small, particularly for estimates of life expectancy at birth, 2009-11 and 2010-12 life tables are not strictly comparable. It is also important to note the larger impact of rebasing on the comparability of life expectancy estimates, see
Technical Note 1: The Effect of Rebasing on Estimates of Life Expectancy.
 Print Page
 Print All