Statistics on sales of new motor vehicles
This article was published in Australian Economic Indicators (cat. no. 1350.0), March 2002
INTRODUCTION
The New Motor Vehicle Sales (NMVS) time series replaces the longstanding New Motor Vehicle Registrations (NMVR) time series commencing with the January 2002 reference month. This note provides information on the similarities and differences between these series.
HISTORICAL BACKGROUND
The ABS commenced disseminating monthly statistics on registrations of new vehicles (via NMVR) in the 1950s. These registrations data provided a proxy for sales of new vehicles and have been used mainly as a general indicator of economic activity. The data were sourced from the various State, Territory and Commonwealth motor vehicle registration authorities and reflected the information in registration documents processed by those authorities. The ABS published original, seasonally adjusted and trend estimated data within four weeks of the reference month.
In the early 1990s, the Federal Chamber of Automotive Industries (FCAI) developed a system, called VFACTS (Vehicle facts), for collecting statistics on retail sales of new motor vehicles by all FCAI member companies. Data are collected electronically and released within a week of the end of the reference month. The output is regarded as very reliable by the industry. VFACTS data are currently not available on a seasonally adjusted or trend basis.
The NMVS series is based on VFACTS data provided by FCAI from which the ABS derives seasonally adjusted and trend data. The NMVS data will be published monthly in this publication (tables 3.8 and 9.6), as well as electronically in both Sales of New Motor Vehicles, Electronic Publication (Cat. no. 9314.0.80.001), available via the ABS website (www.abs.gov.au), and Sales of New Motor Vehicles, Electronic Delivery (Cat. no. 9314.0.55.001) (Ausstats time series).
ABS AND NEW MOTOR VEHICLE STATISTICS
The objectives of NMVR and VFACTS differed, with NMVR being produced as an economic indicator while VFACTS was developed for marketing purposes. The outputs produced, however, were largely comparable and closely tracked for some time (see graphs below). Since new registrations were used as a proxy for sales and therefore represented a duplication of the VFACTS data, the ABS ceased collection of new registrations data from December 2001. The release of vehicle sales data by the ABS commences with the January 2002 reference month. Data items available from the ABS will include sales by vehicle type (passenger, other and total vehicles) and the State/Territory of registration. Further detailed data will only be available from FCAI.
The NMVS series replaces NMVR as a Main Economic Indicator with both electronic publications (catalogue numbers 9314.0.80.001 and 9314.0.55.001) due for release approximately 20 days after the reference month. Data will also be included in the Australian Economic Indicators (Cat.no. 1350.0) which is released on the last working day of each month.
Data for vehicles registered for use on Australian roads for which sales data are not currently available from VFACTS, including motor cycles and unpowered vehicles, will continue to be available from the annual Motor Vehicle Census (MVC).
COMPARISON OF NMVR AND NMVS DATA
The data item 'vehicle type' differs between NMVS and NMVR. 'Passenger vehicles' in NMVS excludes all-terrain vehicles (i.e. 4 wheel drive vehicles with more than 3 but less than or equal to 9 seats). These vehicles are included in 'light trucks'. In NMVR all-terrain vehicles were classified as passenger vehicles.
The category 'other vehicles' in NMVS comprises light trucks (including light buses up to 3.5 tonnes gross vehicle mass), heavy trucks (both rigid and articulated) and buses. Motor cycles, plant and equipment and unpowered vehicles registered for road use are not included in 'other vehicles' in NMVS.
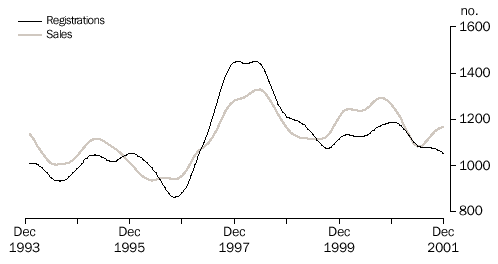
The graphs below present the trend series for both sales and registrations for Australia and each State/Territory for the period January 1994 to December 2001. These graphs highlight some differences between the two series. The main reason for these differences is the time taken for data to be collected and processed in each system. Sales of new vehicles are reported to VFACTS electronically soon after a sale is completed. In contrast, it can take some time for registration of a vehicle to be processed by the relevant authority and passed onto the ABS.
Differences can also occur for other reasons, such as the implementation of a new vehicle registration system in Queensland in late 1999 which led to the number of new registrations being understated for both Queensland and Australia. This is clearly reflected in the graphs relating to Queensland and Australian series. The consistent difference between registrations and sales (see NSW and Tasmania) can result from sales in one State/Territory and registration in another or from the sale of vehicles to fleets.
Note: There was a break in the trend in July 2000 for both series in Australia, New South Wales, Victoria, Queensland, South Australia and Western Australia. This break was the result of changed behaviour arising from the introduction of The New Tax System.
NEW MOTOR VEHICLES, Registrations and Sales-Trend: Australia
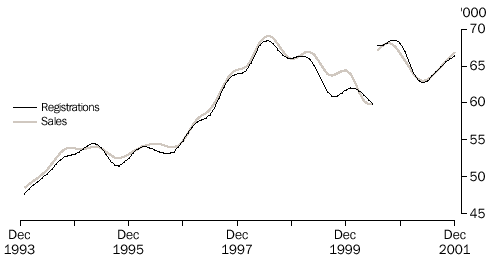
NEW MOTOR VEHICLES, Registrations and Sales-Trend: NSW
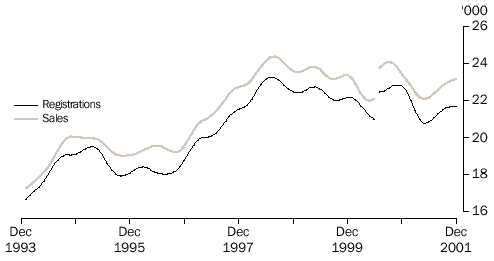
NEW MOTOR VEHICLES, Registrations and Sales-Trend: Vic
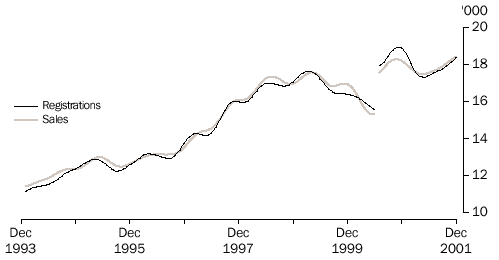
NEW MOTOR VEHICLES, Registrations and Sales-Trend: Qld
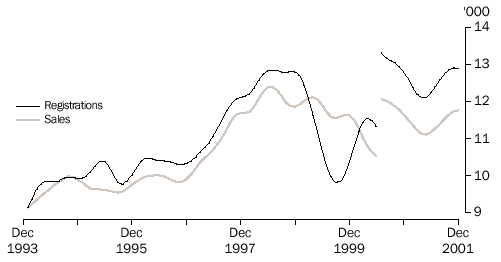
NEW MOTOR VEHICLES, Registrations and Sales-Trend: SA
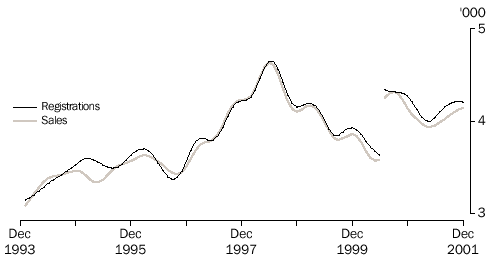
NEW MOTOR VEHICLES, Registrations and Sales-Trend: WA
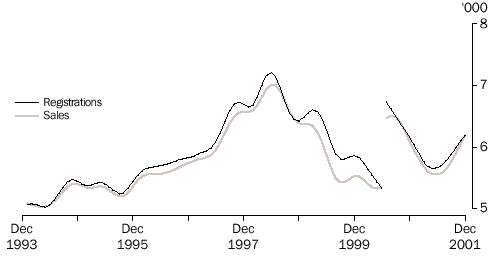
NEW MOTOR VEHICLES, Registrations and Sales-Trend: Tas
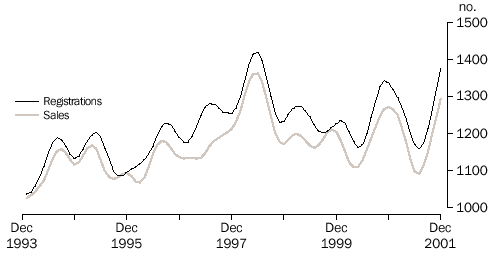
NEW MOTOR VEHICLES, Registrations and Sales-Trend: NT
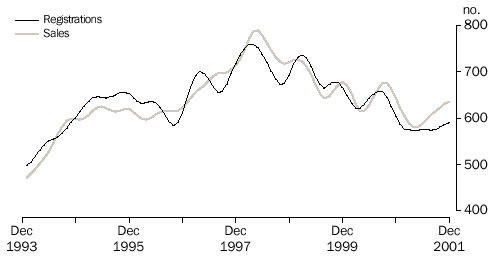
NEW MOTOR VEHICLES, Registrations and Sales-Trend: ACT
FURTHER INFORMATION
More detailed information concerning the introduction of sales data and the future role of the ABS in vehicle statistics is contained in Information Paper: Developments in New Motor Vehicle Statistics (Cat. no 9313.0), available from the ABS website (www.abs.gov.au) or by contacting the ABS National Information and Referral Service.
 Print Page