FEATURE ARTICLE: A STATISTICAL OVERVIEW OF THE CONSTRUCTION INDUSTRY
INTRODUCTION
The construction industry plays an important role in the Australian economy and has shown strong growth over recent years. In 2006-07 the construction industry contributed 6.7% to Gross Domestic Product (GDP) and as at May quarter 2007 employed 9.0% of the Australian workforce.
The demand for and supply of construction is driven by a variety of factors including economic growth, changes in interest rates, immigration policies, labour availability and changes experienced within other industries (e.g. agriculture, mining and manufacturing). There is a current media focus on the residential building component of construction lately due to the low level of housing availability and housing affordability in all major cities.
This article demonstrates the range and usability of data available on the construction sector. It presents what the construction industry is, the significance of the construction industry to the Australian economy and how it has changed over time, the contribution made to the labour force and how average weekly earnings have moved over time, and how the price indexes of materials used in buildings and output from the construction industry have changed over the last four financial years.
CONSTRUCTION INDUSTRY DEFINITION
The construction industry consists of those businesses mainly engaged in the construction of residential and non-residential buildings (including alterations and additions), engineering structures and related trade services classified under the Australian and New Zealand Standard Industrial Classification (ANZSIC) 2006.
CONTRIBUTION TO GROSS DOMESTIC PRODUCT
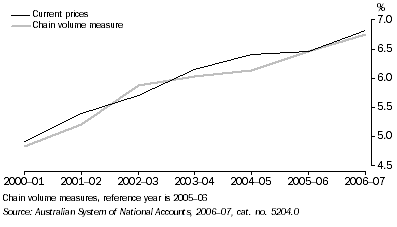
GDP is the total market value of goods and services produced in Australia within a given period after deducting the cost of goods and services used up in the process of production, but before deducting allowances for the consumption of fixed capital. The construction industry has gradually increased as a share of GDP from 5.4% in 2001-02 to 6.8% in 2006-07.
INDUSTRY GROSS VALUE ADDED, Construction Industry as percentage of total GDP
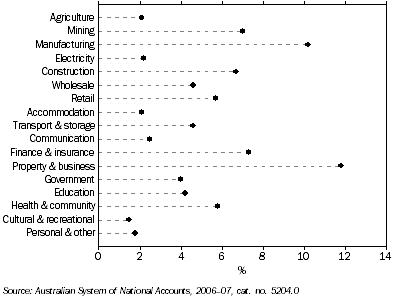
In 2006-07 construction was the fifth largest industry in current price terms. It ranked behind Property and business services (12.2%), Manufacturing (10.3%), Finance and insurance (7.2%) and Mining (7.1%).
INDUSTRY GROSS VALUE ADDED, Percentage of GDP by Industry
- 2006-07
CONSTRUCTION WORK DONE
In chain volume terms, the value of construction work done during 2006-07 was $112,817.1 million, a 5.7% increase from the previous financial year.
In 2006-07, the largest component of the construction industry was Engineering construction at $47,538.5 million, representing 42.1% of total construction.
CONSTRUCTION WORK DONE, Chain Volume Measures |
|  |
 |  | 2002-03 | 2003-04 | 2004-05 | 2005-06 | 2006-07 |  |
|  |
| Value $m |  |  |  |  |  |  |
 | Residential building | 38 561.9 | 41 322.8 | 41 194.5 | 39 076.2 | 39 371.5 |  |
 | Non-Residential building | 19 059.8 | 20 431.5 | 21 305.7 | 23 771.3 | 25 907.2 |  |
 | Total building | 57 677.5 | 61 813.9 | 62 531.9 | 62 847.5 | 65 278.6 |  |
 | Engineering Construction | 28 359.4 | 30 482.7 | 34 938.3 | 43 925.9 | 47 538.5 |  |
 | Total | 85 986.2 | 92 246.0 | 97 479.6 | 106 773.4 | 112 817.1 |  |
| Percentage change from previous year |  |  |  |  |  |  |
 | Residential building | 16.7 | 7.2 | -0.3 | -5.1 | 0.8 |  |
 | Non-Residential building | 11.3 | 7.2 | 4.3 | 11.6 | 9.0 |  |
 | Total building | 14.9 | 7.2 | 1.2 | 0.5 | 3.9 |  |
 | Engineering Construction | 20.1 | 7.5 | 14.6 | 25.7 | 8.2 |  |
 | Total | 16.6 | 7.3 | 5.7 | 9.5 | 5.7 |  |
|  |
| Source: Construction Work Done, Australia, Preliminary, March 2008, cat. no. 8755.0 |
INDUSTRY PERFORMANCE
In 2005-06 (the most recent data available), operating profit before tax for the construction industry rose by 15.1% to $19,485 million from the previous financial year.
Total income rose from $174,162 million in 2004-05 to $198,802 million in 2005-06, an increase of 14.1%. Total expenses rose from $157,655 million in 2004-05 to $179,329 million in 2005-06, an increase of 13.7%.
INDUSTRY PERFORMANCE, Construction - Current Prices |
|  |
 | 2002-03 | 2003-04 | 2004-05 | 2005-06 |  |
| Financial Performance | $m | $m | $m | $m |  |
|  |
| Sales of goods | 14 047 | 15 726 | 16 489 | 18 117 |  |
| Income from services | 123 229 | 141 625 | 153 988 | 177 939 |  |
| Rent, leasing and hiring income | 726 | 830 | 1 121 | 762 |  |
| Funding from government for operational costs | 536 | 33 | 41 | 88 |  |
| Interest income | 1 019 | 460 | 655 | 574 |  |
| Other income | 1 428 | 1 254 | 1 867 | 1 322 |  |
| Total income | 140 984 | 159 928 | 174 162 | 198 802 |  |
| Selected labour costs | 20 387 | 23 649 | 25 860 | 29 564 |  |
| Cost of sales | 101 782 | 113 854 | 123 775 | 141 539 |  |
| Depreciation and amortisation | 2 774 | 2 964 | 3 381 | 3 649 |  |
| Interest expenses | 1 827 | 1 720 | 2 247 | 2 743 |  |
| Other operating expenses | 1 136 | 1 805 | 1 968 | 1 822 |  |
| Total expenses | 128 960 | 145 434 | 157 655 | 179 329 |  |
| Change in inventories | ^1 053 | ^1 441 | **423 | **12 |  |
| Operating profit before tax | 13 078 | 15 935 | 16 930 | 19 485 |  |
|  |
| ^ estimate has a relative standard error of 10% to less than 25% and should be used with caution |
| ** estimate has a relative standard error greater than 50% and is considered too unreliable for general use |
| Source: Australian Industry 2005-06, cat. no. 8155.0 |
BUSINESS INVESTMENT
During the three years from 2003-04 to 2006-07, private new capital expenditure in the construction industry increased by 52.2% from $1,725 million to $2,626 million. This increase was largely due to the increased expenditure on General Construction which increased by 63.3% during this period. Over the three year period, expenditure on Construction Trade Services increased 46.1% from $1,109 million to $1,620 million.
PRIVATE NEW CAPITAL EXPENDITURE(a), Construction Industry |
|  |
 | 2003-04 | 2004-05 | 2005-06 | 2006-07 |  |
 | $m | $m | $m | $m |  |
|  |
| General Construction | 616 | 946 | 1 001 | 1 006 |  |
| Construction Trade Services | 1 109 | 1 348 | 1 461 | 1 620 |  |
| Total Construction | 1 725 | 2 294 | 2 461 | 2 626 |  |
|  |
| (a) Current prices |
| Source: ABS data available on request, Private New Capital Expenditure and Expected Expenditure, Australia, cat. no. 5625.0 |
LABOUR
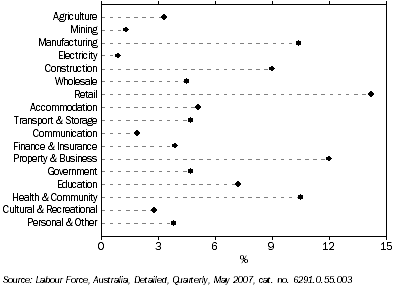
The construction industry is one of the largest employing industries in Australia. As at the May quarter 2007, there were 937,300 people employed in the construction industry representing 9.0% of the total workforce. It was the fifth largest employing industry behind Retail (14.2%), Property and business services (12.0%), Health and community services (10.5%) and Manufacturing (10.4%).
EMPLOYMENT BY INDUSTRY, percentage of total employment
- May 2007
Over the three years from May 2004 to May 2007, the number of persons employed in the construction industry increased from 801,700 persons to 937,300 persons, an increase of 16.9%. This was higher than the increase in the number of people employed in all industries over the same period, which was 8.4%. Of the 937,300 persons employed in the construction industry, 30.7% were employed in General Construction and 66.7% were employed in Construction Trade Services.
PERSONS EMPLOYED(a), Construction Industry |
|  |
 |  | 2004 | 2005 | 2006 | 2007 |  |
 |  | '000 | '000 | '000 | '000 |  |
|  |
| General Construction |  |  |  |  |  |
 | Building Construction | 207.1 | 206.5 | 209.0 | 213.4 |  |
 | Non-Building Construction | 43.4 | 57.1 | 48.1 | 73.6 |  |
 | General Construction nfd | 0.9 | 1.0 | 0.7 | 0.5 |  |
 | Total | 251.4 | 264.6 | 257.8 | 287.5 |  |
| Construction Trade Services |  |  |  |  |  |
 | Site Preparation Services | 40.3 | 47.8 | 57.0 | 54.7 |  |
 | Building Structure Services | 93.2 | 91.9 | 86.8 | 82.2 |  |
 | Installation Trade Services | 162.9 | 171.3 | 180.1 | 212.9 |  |
 | Building Completion Services | 158.1 | 182.4 | 191.5 | 181.3 |  |
 | Other Construction Services | 78.5 | 74.4 | 94.3 | 87.3 |  |
 | Construction Trade Services nfd | 6.0 | 4.2 | 3.5 | 6.5 |  |
 | Total | 539.0 | 572.0 | 613.2 | 624.9 |  |
| Construction - nfd | 11.3 | 18.2 | 18.1 | 24.9 |  |
| Total Construction | 801.7 | 854.7 | 889.1 | 937.3 |  |
| Total All Industries | 9 639.4 | 9 947.9 | 10 143.7 | 10 451.2 |  |
|  |
| (a) All data presented are for May Quarter |
| Source: Labour Force, Australia, Detailed, Quarterly, May 2007, cat. no. 6291.0.55.003 |
| Note: nfd - not further defined |
Hours Worked
Over the period from May 2004 to May 2007, the average hours worked per week by employees in the construction industry was higher than the average for employees in all industries. In May 2007, workers in the construction industry worked an average of 39.0 hours per week compared to an average of 34.7 hours per week in all industry groups.
AVERAGE HOURS WORKED PER WEEK(a), Construction Industry |
|  |
 | 2004 | 2005 | 2006 | 2007 |  |
|  |
| General Construction | 39.8 | 39.1 | 40.5 | 40.5 |  |
| Construction Trade Services | 37.9 | 37.6 | 38.0 | 38.2 |  |
| Construction - nfd | 42.0 | 41.1 | 44.3 | 41.1 |  |
| Construction | 38.5 | 38.2 | 38.8 | 39.0 |  |
| Total All Industries | 34.6 | 34.6 | 34.7 | 34.7 |  |
|  |
| (a) All data presented are for May Quarter |
| Source: Labour Force, Australia, Detailed, Quarterly, May 2007, cat. no. 6291.0.55.003 |
| Note: nfd - not further defined |
Average Weekly Earnings
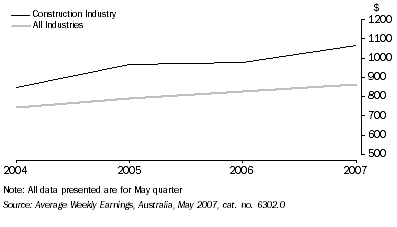
The average weekly earnings (AWE) for employees engaged in the construction industry is higher than the average for all industries. This applies to both full-time adult employees and the AWE for all employees. In May 2007, the AWE for all employees in the construction industry were 23.3% higher than the AWE for all industries. In May 2004, AWE for all employees in the construction industry were 13.7% higher than those for all employees in all industries. For all employees in the construction industry, AWE have increased 25.5% between 2004 and 2007 while AWE for all employees for all industries have increased by 15.7% over this three year period.
AVERAGE WEEKLY EARNINGS(a), Construction and All Industries |
|  |
 |  | 2004 | 2005 | 2006 | 2007 |  |
 |  | $ | $ | $ | $ |  |
|  |
| Construction Industry |  |  |  |  |  |
 | Full-time adult, total earnings | 994.7 | 1 112.5 | 1 103.9 | 1 199.4 |  |
 | All employees | 848.7 | 966.4 | 978.8 | 1 064.9 |  |
| All Industries |  |  |  |  |  |
 | Full-time adult, total earnings | 993.6 | 1 058.5 | 1 088.3 | 1 136.1 |  |
 | All employees | 746.3 | 789.7 | 826.9 | 863.4 |  |
|  |
| (a) All data presented are for May quarter |
| Source: Average Weekly Earnings, Australia, May 2007, cat. no. 6302.0 |
AVERAGE WEEKLY EARNINGS, All employees
Status of Employment
Of persons employed in the construction industry in May 2007, 72.1% (676,000) were employees, compared to 88.3% for all industries. The second highest percentage of workers were engaged on an 'Own account' basis and constituted 22.5% (210,600) of persons employed in construction in May 2007 compared with 8.8% for all industries.
PERSONS EMPLOYED, Status of Employment - May 2007 |
|  |
| Type of Employment | Employee | Employer | Own account worker | Contributing family worker | All employees |  |
|  |
| Construction ('000) | 676.0 | 46.6 | 210.6 | 4.1 | 937.3 |  |
| % of total employment | 72.1 | 5.0 | 22.5 | 0.4 | 100.0 |  |
| All Industries ('000) | 9 230.9 | 273.2 | 917.9 | 29.1 | 10 451.2 |  |
| % of total employment | 88.3 | 2.6 | 8.8 | 0.3 | 100.0 |  |
|  |
| Source: Labour Force, Australia, Detailed, Quarterly, May 2007, cat. no. 6291.0.55.003 |
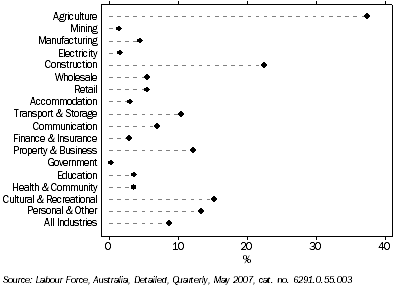
The construction industry had the second highest percentage of Own account workers (22.5%) after the Agriculture, Forestry and Fishing industry in which 37.4% of workers are Own account workers.
OWN ACCOUNT WORKERS, Percentage of Industry Employment
- May 2007
Industrial Disputes
In the construction industry, there has been a 91.9% fall in the number of industrial disputes from 371 in 2003-04 to 30 in 2006-07. This is greater than the drop in the number of industrial disputes for all industries for the same period (-79.9%).
In the construction industry there were 8,100 employees involved in industrial disputes in 2006-07, falling from 105,800 in 2003-04 (-92.3%). There was a similar fall in the number of working days lost for the same period (-92.2%) from 119,500 days in 2003-04 to 9,300 days in 2006-07. The 92.2% fall in the number of working days lost in the construction industry was larger than for all industry (-84.0%) which fell from 552,400 days lost in 2003-04 to 88,400 days lost in 2006-07.
INDUSTRIAL DISPUTES |
|  |
 |  | 2002-03 | 2003-04 | 2004-05 | 2005-06 | 2006-07 |  |
|  |
| Construction Industry |  |  |  |  |  |  |
 | Number of Disputes (no.) | 296.0 | 371.0 | 283.0 | 146.0 | 30.0 |  |
 | Employees involved ('000) | 59.4 | 105.8 | 82.2 | 41.6 | 8.1 |  |
 | Working days lost ('000) | 111.1 | 119.5 | 111.9 | 52.4 | 9.3 |  |
 | Working days lost per employee involved | 1.9 | 1.1 | 1.4 | 1.3 | 1.1 |  |
| All Industries |  |  |  |  |  |  |
 | Number of Disputes (no.) | 703.0 | 717.0 | 570.0 | 354.0 | 144.0 |  |
 | Employees involved ('000) | 133.9 | 330.6 | 156.2 | 227.1 | 73.4 |  |
 | Working days lost ('000) | 244.7 | 552.4 | 243.2 | 188.6 | 88.4 |  |
 | Working days lost per employee involved | 1.8 | 1.7 | 1.6 | 0.8 | 1.2 |  |
|  |
| Source: ABS data available on request, Industrial Disputes, Australia, cat. no. 6321.0.55.001 |
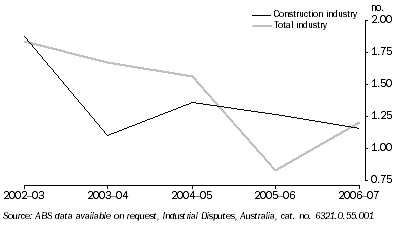
In 2006-07, the ratio of working days lost per employee involved in industrial disputes is lower in the construction industry than for all industries. The average number of working days lost per construction industry employee involved in industrial disputes was 1.15 days, while for all industries, the average number of days lost for employees involved in industrial disputes was 1.2 days.
INDUSTRIAL DISPUTES, Working days lost per employee
PRODUCER PRICES
The producer price indexes for the materials used in building showed increases over the period observed in the table below with the index of materials used in house building increasing 8.8% from 2002-03 to 2005-06 and materials used in other than house building increasing 3.3% from 2002-03 until 2003-04 when the series was discontinued.
PRODUCER PRICE INDEXES(a), Materials used in building |
|  |
 | 2003-04 | 2004-05 | 2005-06 | 2006-07 |  |
|  |
| Materials used in House Building | 134.3 | 138.8 | 142.0 | 147.0 |  |
|  |
| (a) Reference base 1989-90 = 100.0 |
| Source: Producer Price Indexes, Australia, March 2008, cat. no. 6427.0 |
Similarly, the producer price index for output from the construction industry has also shown increases over the observation period (2003-04 to 2006-07). House construction increased 12.9%, Residential building construction nec 19.7%, Non-residential building construction 22.3%, Road and bridge construction 15.8% and General construction 17.6%.
PRODUCER PRICE INDEXES, Output from Construction Industry(a) |
|  |
 | 2003-04 | 2004-05 | 2005-06 | 2006-07 |  |
|  |
| House construction | 123.7 | 130.6 | 136.1 | 139.7 |  |
| Residential building construction n.e.c. | 121.0 | 132.1 | 138.7 | 144.8 |  |
| Non-residential building construction | 119.5 | 131.3 | 138.2 | 146.2 |  |
| Building construction | 121.2 | 130.6 | 136.8 | 142.5 |  |
| Road and bridge construction | 120.8 | 125.8 | 133.2 | 139.9 |  |
|  |
| (a) Reference base of each index: 1998-99 = 100.0 |
| Source: Producer Price Indexes, Australia, March 2008, cat. no. 6427.0 |
CONCLUSION
Construction is an important industry in the economy, contributing 6.7% to GDP in 2006-2007, ranked just behind the mining industry. Engineering construction has been the fastest growing sector over the last five years. This sector overtook the residential building sector in value of projects in 2005-06, and increased this lead in 2006-07. Growth in average weekly earnings for employees in the construction industry has also shown rapid growth. More people are employed in the sector than ever before, although it appears more people are still required by the industry.
These and other construction industry indicators affirm the importance of construction in the economy.
 Print Page